This panel passes every check a client knows how to ask for. Age matches the census, sex matches, region matches. It is ten percentage points wrong, and the weighting procedure designed to fix exactly this problem leaves it precisely where it was.
- Setting
- An opt-in online panel of 5,197 adults recruited to quotas that match the census on age, sex and region, alongside a 420-person probability sample of the same population.
- The question
- What share of adults have used a particular public service?
- Why it matters
- The panel is cheap, fast, and passes every check a client knows how to run. Someone has to decide whether that is enough to publish the number.
- What we do
- Rake the panel to census margins and watch it change nothing, find the variable that actually selected people, rake again on that, and finally price the whole panel in equivalent random-sample terms.
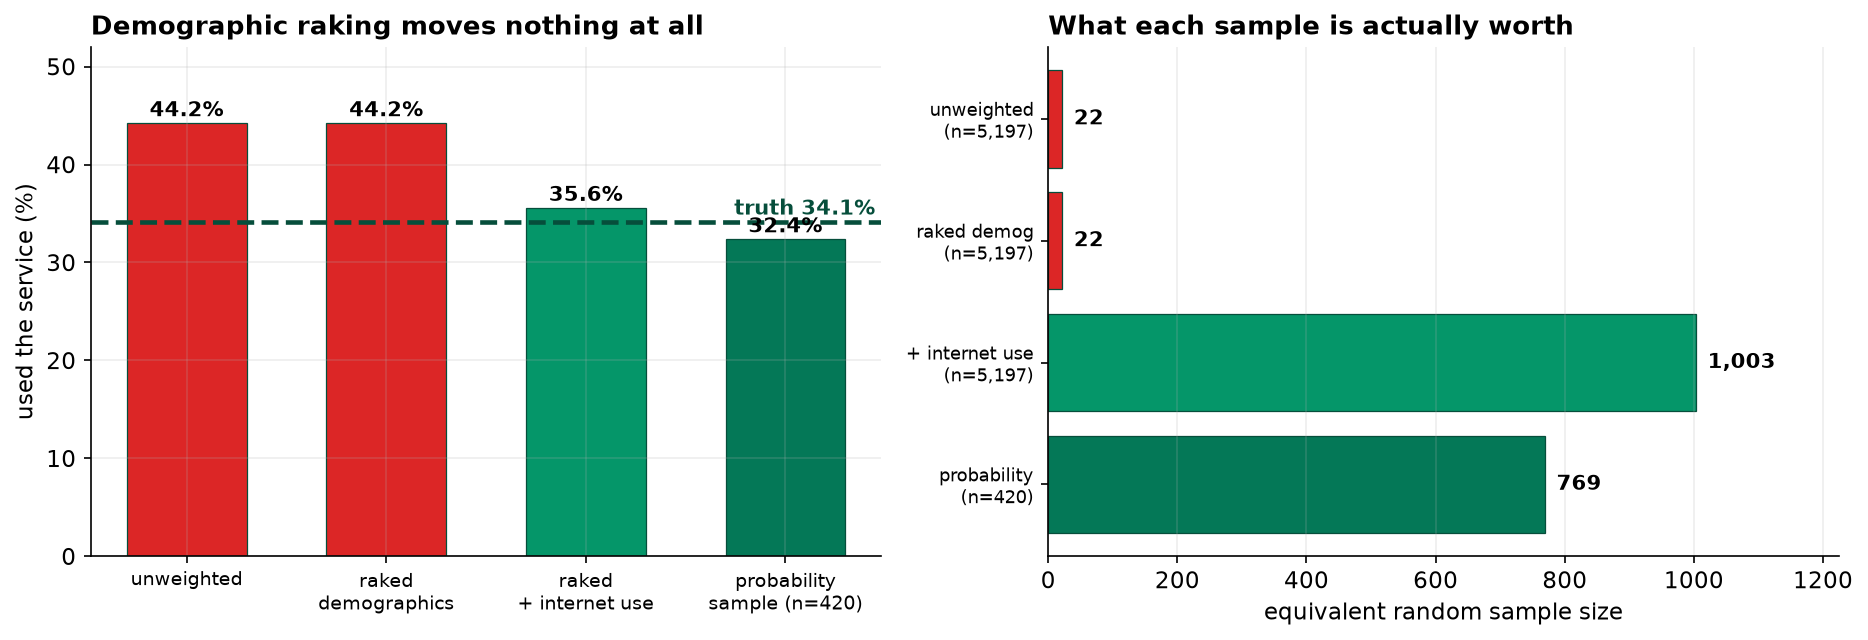
The panel says 44.2%; the truth is 34.1%. Raking to the census changes the estimate by 0.001 of a percentage point. Priced honestly, 5,197 opt-in respondents are worth a random sample of 22 people, and the 420-person probability sample is worth 769.
A Sample With No Selection Probabilities
The target population is 240,000 adults. There is no frame. Panel members opted in through advertising and referrals, so the probability that any given adult is in this sample is unknown and cannot be recovered. That one sentence rules out every standard error in the book.
Quota sampling is the industry's answer. Recruitment continues until the panel matches known population shares on a few demographics: fast, cheap, and the resulting file looks convincing.
A quota tells the recruiter how many 35-to-54-year-old women in the Midwest to sign up. It says nothing about which ones. Inside every quota cell, membership was decided by willingness to join an online panel, and willingness is not a coin flip.
Every Check a Client Would Run, Passed
Cleaning removed two duplicate submissions and three blank outcomes, leaving 5,197 usable respondents. Then the representativeness checks.
| Variable | Panel | Population | Gap |
|---|---|---|---|
| Age 18-34 | 30.1% | 30.1% | 0.0 |
| Age 35-54 | 34.9% | 35.0% | 0.0 |
| Age 55+ | 34.9% | 34.9% | 0.0 |
| Female | 51.1% | 51.1% | 0.0 |
| Northeast / Midwest | 27.8% / 22.2% | 27.8% / 22.2% | 0.0 |
| South / West | 34.9% / 15.0% | 34.9% / 15.0% | 0.0 |
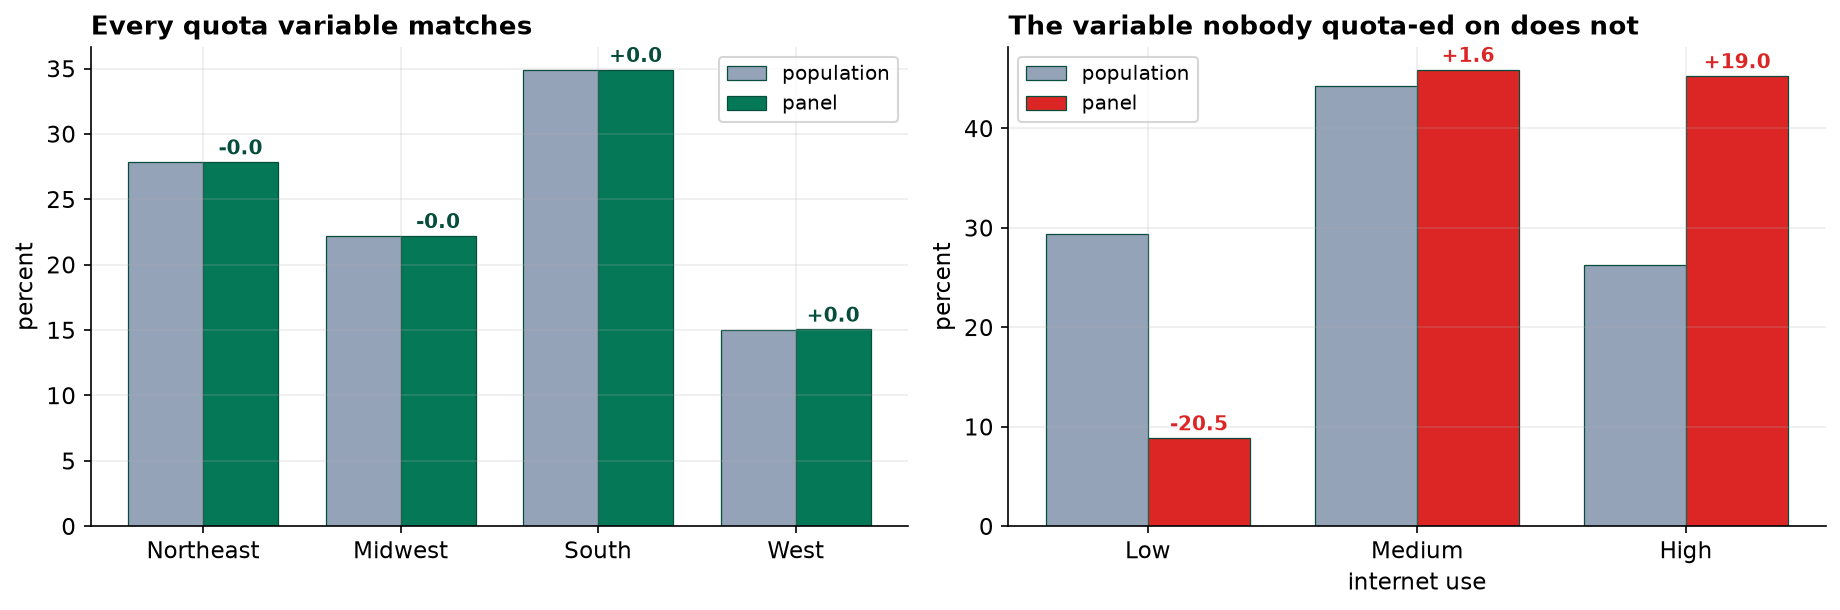
Every quota was met to within a rounding error. If a client asked whether the sample was representative, every check they know how to run would say yes.
And It Is Ten Points Wrong
The probability sample of 420 is out by 1.7 points and its interval contains the truth. The panel's error is six times larger on twelve times the sample. That is the entire argument for probability sampling in two lines, and it is why survey organizations still pay for expensive fieldwork when a panel costs a fraction as much.
The Standard Repair Does Nothing
Raking is the accepted fix: adjust the weights until every margin matches the census. Applied here to age by sex and to region, it produces weights between 0.999 and 1.002 and moves the estimate by 0.001 of a percentage point.
Raking corrects a sample whose margins are wrong, and these margins were already right, because the panel was recruited to make them right. There is nothing left for the procedure to adjust.
So the panel was built to pass exactly the check that the standard repair performs. The repair certifies it, changes nothing, and the ten-point error survives untouched. A report that said "weighted to census margins" would be true and would mean nothing.
Find What Actually Selected People
If demographics are not what makes this panel unusual, something else is. The questionnaire also carried a self-reported internet-use band, and an official communications survey publishes the same bands for the whole population.
| Internet use | Panel | Population | Gap | Used the service |
|---|---|---|---|---|
| Low | 8.9% | 29.4% | −20.5 pp | 13.3% |
| Medium | 45.9% | 44.3% | +1.6 pp | 32.2% |
| High | 45.3% | 26.3% | +19.0 pp | 62.5% |
There it is. That is who volunteers for an online panel, and it was invisible in every demographic check because it cuts across age, sex and region rather than lining up with them. It also matters enormously here: heavy internet users are nearly five times likelier to have used an online service. A variable that predicts both joining and the outcome is the definition of the thing that biases an estimate.
Rake Again, on the Variable That Matters
| Estimate | Value | Error | Recovered |
|---|---|---|---|
| Panel, unweighted | 44.24% | +10.15 pp | — |
| Panel, raked on demographics | 44.24% | +10.15 pp | 0% |
| Panel, raked + internet use | 35.59% | +1.50 pp | 85% |
| Probability sample | 32.38% | −1.71 pp | — |
| True value | 34.09% | — | — |
Eighty-five percent of the bias, gone. Two warnings come with it.
The weight range is 34 to 1, far beyond the four-to-one in Capstone 17. A few hundred light internet users are each standing in for dozens of people, and if those few happen to be unusual the correction inherits their oddity. The effective sample size falls from 5,197 to about 3,000, a design effect of 1.74.
This worked because someone thought to ask about internet use and an official source published the matching margin. Neither was guaranteed. Had the panel carried nothing but demographics, the ten-point error would have been not merely unfixable but undetectable, and the study would have reported 44 percent with total confidence.
What Is This Panel Actually Worth?
Sample size is the wrong currency for a biased sample. The useful question is how large a random sample would have to be to be this far off. Setting the standard error of a simple random sample equal to the observed error and solving for n answers it.
| Sample | n | Error | Equivalent random sample |
|---|---|---|---|
| Opt-in panel, unweighted | 5,197 | 10.15 pp | 22 |
| Opt-in panel, raked demographics | 5,197 | 10.15 pp | 22 |
| Opt-in panel, + internet use | 5,197 | 1.50 pp | 1,003 |
| Probability sample | 420 | 1.71 pp | 769 |
The 5,197-person panel is worth about twenty-two people. That is not rhetoric, it is the arithmetic. Raking on demographics leaves it at twenty-two, because it changed nothing. Raking on internet use lifts it to around a thousand, a genuine achievement that still means 80 percent of the fieldwork bought nothing.
Doubling the panel to 10,000 would halve the sampling error, which was never the problem, and leave the ten-point bias exactly where it is. Sample size fights variance, and this was never a variance problem. The 420 expensive interviews beat the 5,197 cheap ones because they were drawn at random, and nothing else about them was better.
What to Watch
- A quota sample that matches the census is not representative, and it is sold as though it were. Every demographic check passes. That is a fact about the recruitment, not evidence about the estimate.
- Weight on what selected people, not on what is conventional. Age, sex and region get weighted because they are always available, not because they are always the drivers. Here they were irrelevant.
- Publish the weight range. A 34-to-1 spread means a few respondents carry whole population segments. That is a fragile estimate however good the central value looks.
- Never quote a margin of error for an opt-in panel without saying what it excludes. The sampling error on 5,197 responses is about 1.4 points. The actual error was 10.
- Keep a probability benchmark if you can afford one at all. A small random sample alongside a large panel is what turned an invisible problem into a measured one, and it cost a fraction of the panel.
Non-Probability Samples in Data Science & AI
Almost every dataset in modern practice is a convenience sample, and the panel's failure mode is the standard one.
| Where it appears | The unmeasured selector |
|---|---|
| App telemetry | Willingness to keep the app installed, which tracks satisfaction |
| Opt-in feedback widgets | Strength of feeling, in both directions |
| Crowdsourced labels | Whoever finds the task worth the fee at that hour |
| Beta program users | Enthusiasm and technical confidence, exactly as here |
| Balanced benchmark suites | Balanced on the axes someone thought of, and no others |
Rebalancing a training set on demographic attributes is this chapter's raking step, and it inherits the same limitation. If the mechanism that decided which examples were collected is not one of the attributes you balanced on, balancing changes the composition and not the bias. The uncomfortable corollary is the arithmetic in section 7: a very large biased dataset can carry less information about a population than a small carefully drawn one, and no amount of scale reverses it. Meng's work on this shows the effect worsens as the population grows, which is precisely the regime modern datasets operate in.
The full project, step by step
The companion notebook verifies that every quota was met, compares the panel against a probability sample and against the truth, implements iterative proportional fitting from scratch and shows it changing nothing, locates the variable that actually selected respondents, rakes again to recover 85 percent of the bias, and closes by pricing all four estimates in equivalent-random-sample terms.
The dataset
(capstone-repairing-an-online-panel.xlsx) holds the 5,200-member opt-in panel, an independent
420-person probability sample for comparison, the census margins for raking, an official internet-use margin,
and the true population value. Two written reports accompany it: a plain-language brief for a
research buyer, and a technical report covering the raking, the weight diagnostics and the
equivalent-sample-size argument.
🎓 Key Takeaways
- ✓Matching the census is not being representative. Every quota matched to a rounding error and the estimate was 10 points out.
- ✓Raking cannot fix margins that already match. Weights came out at 1.00 and the estimate moved by 0.001 points.
- ✓Weight on the selector. Internet use drove both joining and the outcome; adding it recovered 85% of the bias.
- ✓Price the sample honestly. 5,197 opt-in respondents were worth a random sample of 22; the 420-person probability sample was worth 769.
- ✓Scale fights variance, not bias. Doubling the panel would halve a standard error that was never the problem.
Quiz: Test Yourself
Eight questions on quota samples, raking and what a biased sample is worth. Answer them, hit Check Answers, and keep refining until you score 100%. Your progress is saved.