Bias in a Quota-Matched Volunteer Panel: The Limits of Raking and the Value of a Probability Benchmark
Why margin calibration on demographics achieved nothing, and what the panel is worth in random-sample equivalents.
Objective. To estimate the population prevalence of an online service, and to characterize the bias structure of a quota-matched volunteer panel. Methods. An opt-in panel (n = 5,197) recruited to population quotas on age, sex and region was compared against an independent probability sample (n = 420) and against the enumerated population value. Weights were constructed by iterative proportional fitting, first to the demographic margins alone and then additionally to an externally published internet-use margin. Estimator performance is reported in equivalent simple-random-sample size. Results. Quota agreement was exact to three decimal places on all margins. The unweighted panel estimate was 0.4424 against a population value of 0.3409, a bias of +0.1015. Raking to the demographic margins produced weights in [0.999, 1.002] and altered the estimate by -0.00001. The panel over-represented high internet users by +19.0 points and under-represented low users by -20.5; service use varied from 0.133 to 0.625 across those bands. Raking additionally on internet use gave 0.3559 (bias +0.0150), removing 85% of the bias, with weights in [0.25, 8.29] and effective n = 2990. In equivalent-SRS terms the unweighted panel is worth 22 observations and the probability sample 769. Conclusions. Margin calibration cannot correct a sample whose margins are already correct. Bias correction requires a covariate associated with both selection and outcome, and its availability is contingent rather than assured.
1. Introduction
Volunteer panels are the dominant vehicle for survey research on cost grounds, and their standard quality assurance is demographic representativeness: the achieved sample is compared against census margins, and weights are constructed to reconcile any discrepancy. This report examines a case in which that assurance is vacuous by construction, because the sample was recruited to satisfy precisely the criterion the assurance tests.
The case is instructive rather than exceptional. Quota recruitment guarantees margin agreement; margin calibration then finds nothing to correct; and the bias arising from differential willingness to join, which is the defining feature of a volunteer sample, is untouched by either. The magnitude of the resulting error is quantified here against an enumerated population, and its practical significance is expressed in equivalent random-sample terms.
2. Design
| Element | Panel | Probability sample |
|---|---|---|
| Frame | None; opt-in via advertising and referral | Electoral register |
| Selection probabilities | Unknown and unrecoverable | Known |
| Method | Quota sampling on age, sex, region | Simple random sampling with in-person follow-up |
| Achieved n | 5,197 | 420 |
| Cost profile | Low per interview | High per interview |
3. Quota agreement
| Margin | Panel | Population | Difference |
|---|---|---|---|
| Age 18-34 | 30.1% | 30.1% | 0.0 pp |
| Age 35-54 | 34.9% | 35.0% | 0.0 pp |
| Age 55+ | 34.9% | 34.9% | 0.0 pp |
| Female | 51.1% | 51.1% | 0.0 pp |
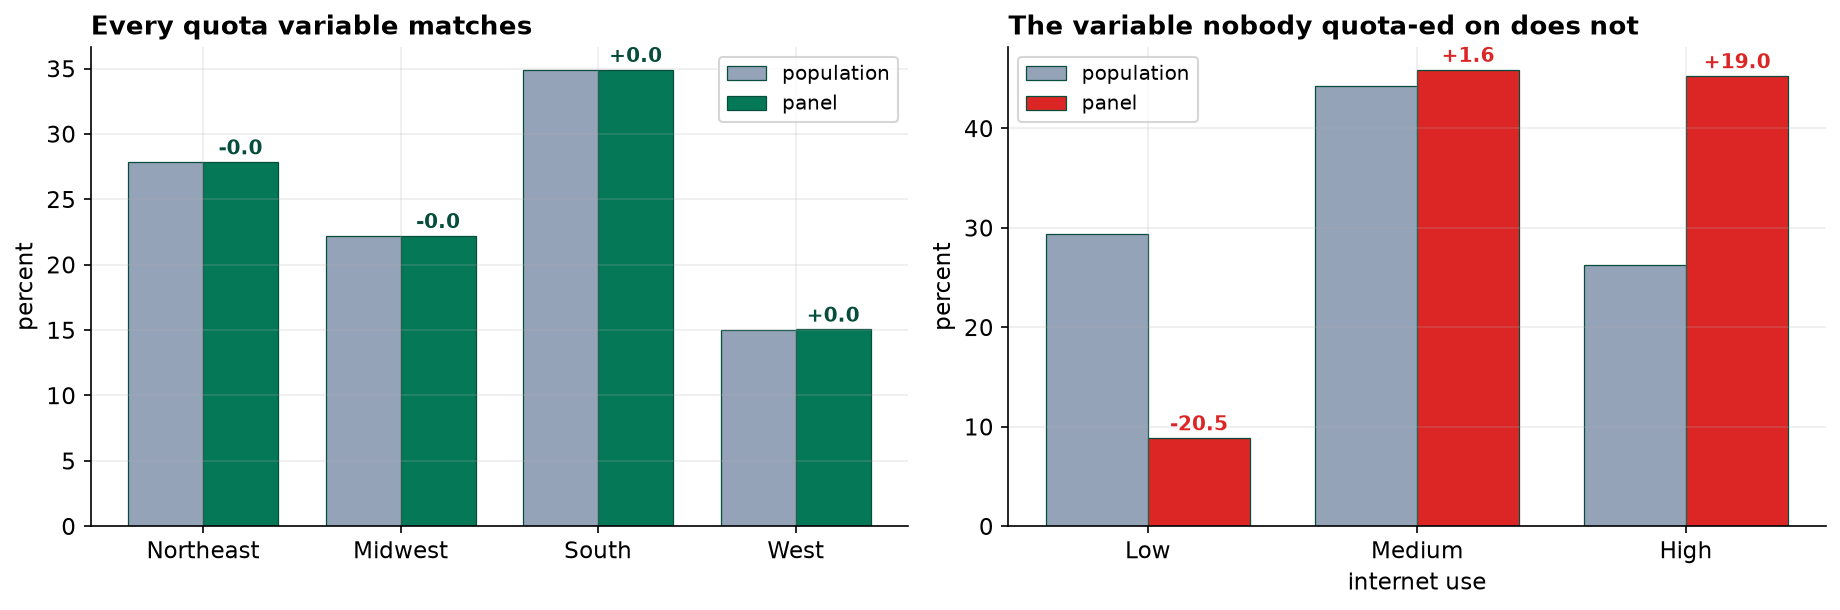
| Northeast | 27.8% | 27.8% | 0.0 pp |
| Midwest | 22.2% | 22.2% | 0.0 pp |
| South | 34.9% | 34.9% | 0.0 pp |
| West | 15.0% | 15.0% | 0.0 pp |
4. Estimation and calibration
| Estimator | Estimate | Bias | Weight range | Effective n |
|---|---|---|---|---|
| Panel, unweighted | 0.4424 | +0.1015 | — | 5,197 |
| Panel, raked to demographics | 0.4424 | +0.1015 | [0.999, 1.002] | 5,197 |
| Panel, raked + internet use | 0.3559 | +0.0150 | [0.25, 8.29] | 2990 |
| Probability sample | 0.3238 | -0.0171 | — | 420 |
| Population value | 0.3409 | — | — | 240,000 |
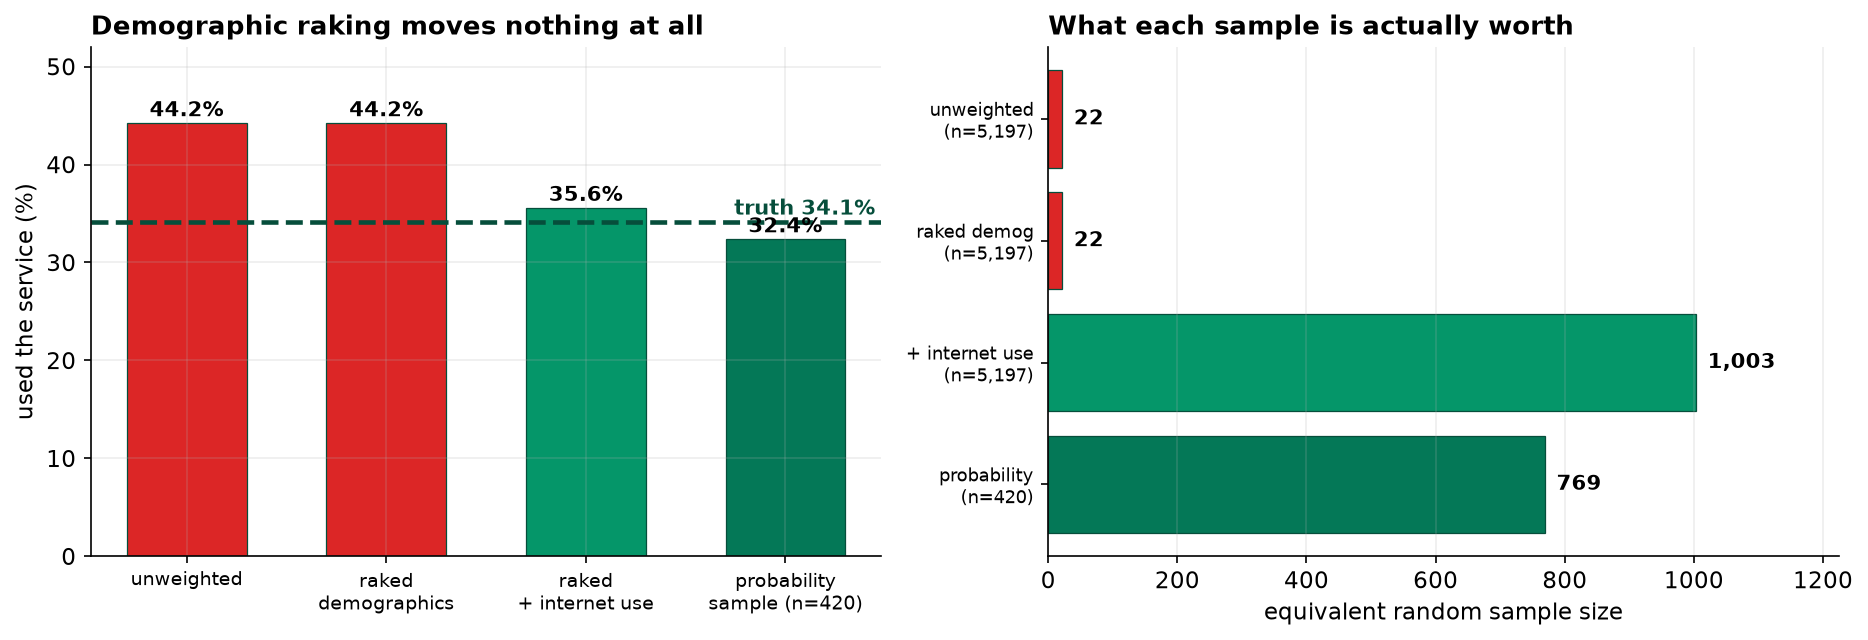
Demographic raking altered the estimate by -0.00001, with all weights within 0.2% of unity. This is the expected result and not a failure of implementation: iterative proportional fitting converges immediately when the achieved margins already equal the targets. The procedure has no purchase on within-cell composition, which is where quota sampling concentrates its selection.
5. Locating the selection variable
| Internet use | Panel share | Population share | Difference | Service use |
|---|---|---|---|---|
| Low | 8.9% | 29.4% | -20.5 pp | 13.3% |
| Medium | 45.9% | 44.3% | +1.6 pp | 32.2% |
| High | 45.3% | 26.3% | +19.0 pp | 62.5% |
Internet use is orthogonal to the quota variables in the sense that matters: a sample can be exactly balanced on age, sex and region while containing three times too few low-use respondents. No demographic diagnostic would detect this, and no demographic weighting scheme can correct it.
Including the margin in the raking recovers 85% of the bias. The residual of +0.0150 reflects the coarseness of a three-level proxy for what is in reality a continuous propensity, and within-band selection persists.
6. Estimator value in equivalent random-sample terms
| Sample | n | Absolute error | Equivalent SRS n |
|---|---|---|---|
| Panel, unweighted | 5,197 | 0.1015 | 22 |
| Panel, raked to demographics | 5,197 | 0.1015 | 22 |
| Panel, raked + internet use | 5,197 | 0.0150 | 1,003 |
| Probability sample | 420 | 0.0171 | 769 |
Expressing accuracy as an equivalent random-sample size makes the comparison interpretable to non-specialists and removes the misleading reassurance of a large n. On this metric the panel of 5,197 is worth 22 observations unweighted, and the probability sample of 420 is worth 769. The disparity is a factor of approximately 35 in favor of the design twelve times smaller.
It follows that increasing panel size is not a remedy. Sample size reduces variance; the deficiency here is bias, which is invariant to n. Doubling the panel would halve a standard error of approximately 1.4 percentage points while leaving a bias of 10 points unchanged, and would increase confidence in a wrong answer.
7. Discussion
Three conclusions follow. First, demographic representativeness is a necessary and conspicuously insufficient condition, and in a quota design it is guaranteed rather than informative. Reporting it as evidence of sample quality is misleading, and reporting margin calibration performed on already-matching margins is doubly so.
Second, bias correction requires an auxiliary variable associated with both selection and outcome, together with an external population margin for it. Both were available here by good fortune: the instrument happened to carry an internet-use item and an official communications survey publishes the corresponding distribution. Where they are not available the bias is neither correctable nor detectable, and the estimate will be reported with unwarranted confidence.
Third, the probability benchmark is what converted an invisible problem into a measured one, at a small fraction of the panel's cost. Maintaining a modest probability sample alongside a large volunteer panel is the most economical insurance available against exactly this failure.
A note on weight diagnostics. The final weights span a 34-fold range, materially wider than is usually considered acceptable, and the effective sample size falls to approximately 3,000. The corrected estimate rests heavily on a few hundred low-internet-use respondents, and its stability is correspondingly limited. The weight range should be published alongside any weighted estimate.
8. Conclusion
A volunteer panel matching population quotas exactly on age, sex and region produced an estimate biased by +0.1015. Raking to those margins changed the estimate by -0.00001, since the margins were already satisfied by construction. Raking additionally to an external internet-use margin recovered 85% of the bias. Measured in equivalent random-sample size, the unweighted panel of 5,197 is worth 22 observations and a probability sample of 420 is worth 769.
References
- Meng, X.-L. (2018). Statistical paradises and paradoxes in big data. Annals of Applied Statistics, 12(2), 685–726.
- Bradley, V. C., Kuriwaki, S., Isakov, M., Sejdinovic, D., Meng, X.-L., & Flaxman, S. (2021). Unrepresentative big surveys significantly overestimated US vaccine uptake. Nature, 600, 695–700.
- Deming, W. E., & Stephan, F. F. (1940). On a least squares adjustment of a sampled frequency table. Annals of Mathematical Statistics, 11(4), 427–444.
- Baker, R., Brick, J. M., Bates, N. A., et al. (2013). Summary report of the AAPOR task force on non-probability sampling. Journal of Survey Statistics and Methodology, 1(2), 90–143.
- Kish, L. (1965). Survey Sampling. Wiley.
- Little, R. J. A., & Vartivarian, S. (2005). Does weighting for nonresponse increase the variance of survey means? Survey Methodology, 31(2), 161–168.
- Valliant, R., Dever, J. A., & Kreuter, F. (2018). Practical Tools for Designing and Weighting Survey Samples (2nd ed.). Springer.
Reproducibility
The dataset (capstone-repairing-an-online-panel.xlsx), containing the panel, the probability sample, the census and official margins and the enumerated population value, accompanies the chapter together with an executable notebook implementing iterative proportional fitting from first principles and reproducing every statistic, table and figure. Analyses use NumPy, pandas and Matplotlib.