Paired Analysis of Ordinal Service Ratings Across a Process Change
Wilcoxon signed-rank under three zero-handling conventions, with a sign-test sensitivity check.
Keywords: Wilcoxon signed-rank; zero differences; Pratt's method; sign test; matched-pairs rank-biserial; ordinal scales; tied ranks; pre-post design.
1. Introduction
Pre-post designs on ordinal rating scales are among the most frequently analyzed structures in applied customer research, and among the most frequently mis-analyzed. Two features of such data create difficulties that continuous paired outcomes do not. First, differences are restricted to a small set of integers, so no transformation renders them approximately continuous. Second, a substantial proportion of respondents return the identical value at both occasions, producing differences of exactly zero, for which the signed-rank statistic has no defined contribution.
The second feature is the more consequential and the less discussed. Statistical software resolves it through a default argument, and the choice of default silently determines both the effective sample size and the population about which inference is drawn. This report computes all three standard conventions and reports the sample each consumes.
The hypotheses are H₀: the distribution of the before-minus-after differences is symmetric about zero, against H₁: it is not, evaluated two-sided at α = 0.05.
2. Data
| Step | Rule | Result |
|---|---|---|
| Raw export | — | 76 rows |
| De-duplication | drop duplicate submissions | 74 rows |
| Complete pairs | retain customers with both ratings | 71 rows |
| Range validation | retain ratings 1–5 | 70 rows |
| Rating | 1 | 2 | 3 | 4 | 5 |
|---|---|---|---|---|---|
| Before | 2 | 12 | 27 | 25 | 4 |
| After | 2 | 10 | 19 | 18 | 21 |
| Change in rating | −1 | 0 | +1 | +2 |
|---|---|---|---|---|
| Customers | 7 | 31 | 28 | 4 |
The three customers lost to follow-up warrant comment. Attrition in satisfaction research is rarely independent of the outcome: disengagement predicts both lower ratings and non-response. Complete-case analysis, which a paired test requires, therefore carries a plausible optimistic bias of unknown magnitude. With three cases out of 73 the effect on the conclusion is small, but the mechanism is worth naming because it does not scale down in larger studies.
3. Methods
Shapiro-Wilk on the differences gave W = 0.848, p = 5.9e-07. The test statistic understates the situation: the differences are not an imperfectly normal continuous variable but a four-valued discrete one. No monotone transformation alters the number of distinct values, so the parametric route is closed rather than merely inadvisable.
The Wilcoxon signed-rank test ranks the absolute differences and compares the rank sum attaching to positive changes against that attaching to negative ones. Three conventions for zero differences were computed:
- Discard (Wilcoxon, 1945): zero differences are removed before ranking. The test is conducted on the subsample that changed.
- Pratt (1959): zeros are included in the ranking, then their ranks are excluded from both sums. The full sample is retained and the zeros depress the contribution of small non-zero changes.
- Split: the ranks attaching to zeros are divided equally between the two sums.
Effect size is reported as the matched-pairs rank-biserial correlation, (R⁺ − R⁻) / (R⁺ + R⁻), computed on the non-zero differences. A binomial sign test on the direction of change provides a sensitivity check under minimal assumptions. Analyses used SciPy in Python 3.
4. Results
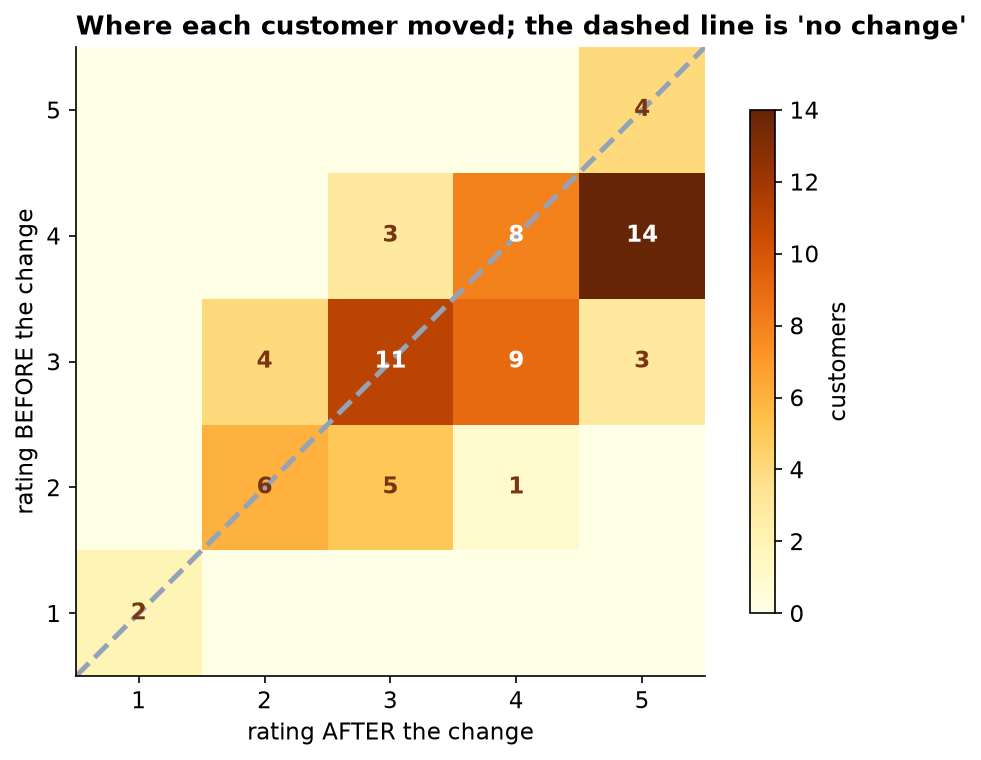
| Zero-handling convention | n used | W | p-value |
|---|---|---|---|
| Discard zeros (Wilcoxon, 1945) | 39 | 126.0 | 5.040e-05 |
| Pratt (1959) · reported | 70 | 343.0 | 4.827e-05 |
| Split zero ranks | 70 | 591.0 | 9.020e-05 |
The conventions agree substantively, all three p-values falling below 10⁻⁴. That agreement is a property of this dataset and not a general result: divergence is expected when the non-zero effect is marginal and the zero proportion is high. Pratt's method is reported as primary because the research question concerns the customer base as a whole rather than the subset whose opinion moved. Under the discard convention the inferential sample is 39 rather than 70, a distinction that materially changes the population described and that is not visible in a reported p-value.
| Quantity | Value |
|---|---|
| Customers rating higher | 32 (46%) |
| Customers unchanged | 31 (44%) |
| Customers rating lower | 7 (10%) |
| Rank sum, increases | 654.0 |
| Rank sum, decreases | 126.0 |
| Matched-pairs rank-biserial | 0.677 |
| Sign test (direction only) | p = 7.025e-05 |
The sign test discards the magnitudes entirely and relies only on the direction of change. It therefore assumes less than the signed-rank test, which requires symmetry of the difference distribution, and correspondingly has lower power. Its agreement (p = 7.0e-05) establishes that the conclusion does not depend on the symmetry assumption.
5. Tied magnitudes and the unavailability of an exact test
Among the 39 non-zero differences there are exactly two distinct magnitudes: 35 changes of one point and 4 of two points. The signed-rank procedure ranks by magnitude, so these form two large tied blocks receiving average ranks.
The exact permutation distribution of the signed-rank statistic is derived under the assumption of no ties in the absolute differences, and is therefore inapplicable. The implementation used detects this and applies the normal approximation with the variance correction for tied ranks. This is the correct behavior, and it is recorded here because on coarse ordinal scales the tie correction is not a marginal adjustment: it is doing substantial work, and a report that quotes an exact p-value on such data has almost certainly obtained it by suppressing the tie structure.
6. Statistical against practical significance
| Summary | Before | After |
|---|---|---|
| Median rating | 3 | 4 |
| Top-two-box (4 or 5) | 29 (41%) | 39 (56%) |
| Bottom-two-box (1 or 2) | 14 (20%) | 12 (17%) |
The median advanced one step, from 3 to 4, and the top-two-box proportion rose 14 percentage points. Against a p-value of 5e-05 and a large rank effect, this is a reminder that the two quantities answer different questions. The inferential result concerns whether the observed movement is attributable to chance; it carries no information about whether the movement is worth its cost. Reporting the proportions in all three directions, rather than the test result alone, is what allows a reader to judge the second question.
7. Interval estimates for the response proportions
| Quantity | Estimate | 95% CI | Method |
|---|---|---|---|
| Rated higher | 46% | 35% to 57% | Wilson |
| Unchanged | 44% | 33% to 56% | Wilson |
| Rated lower | 10% | 5% to 19% | Wilson |
| Top-two-box, before | 41% | 31% to 53% | Wilson |
| Top-two-box, after | 56% | 44% to 67% | Wilson |
| Matched-pairs rank-biserial | 0.677 | 0.438 to 0.879 | percentile bootstrap |
The proportions are the quantities most likely to be transferred into operational reporting, and each is estimated from seventy observations with margins of ten to eleven percentage points.
The two top-two-box intervals overlap substantially, and it would be an error to infer from that overlap that the change is unsupported. The estimates are computed on the same respondents at two occasions and are therefore not independent; the overlap of marginal intervals is not a valid test of a within-subject change. The appropriate analysis is of the discordant pairs, of which thirteen crossed into the top two boxes and three crossed out (p = 0.02).
A covariate recorded but not previously analyzed, monthly visit frequency, shows no association with the magnitude of change (ρ = 0.09, p = 0.44), and a median split produces comparable improvement in both strata. The improvement is therefore not confined to high-frequency users. This addresses one alternative explanation and not the principal one: in the absence of a concurrent control, any contemporaneous influence would affect both strata and would leave precisely this pattern.
8. Discussion
Ratings improved following the process change. Four limitations bear on interpretation.
First, and decisively for causal claims, the design is single-group pre-post with no concurrent control. Secular trend, seasonality, unlogged operational changes, and testing effects are all unexcluded. The analysis establishes that ratings moved, not what moved them. A staged rollout retaining a portion of the customer base on the previous process would resolve this at modest cost.
Second, repeated measurement of the same respondents introduces a consistency motive: some proportion of the unchanged responses may reflect recall of the first answer rather than a stable opinion. This biases differences toward zero and is therefore conservative with respect to the finding.
Third, the outcome is ordinal, and the arithmetic mean of an ordinal scale presupposes interval spacing the instrument does not establish. Means are omitted from Section 6 for this reason, following the argument set out in the correlation capstone of this series. Proportions at each level, or top-box summaries, carry no such presupposition.
Fourth, the zero-handling convention should be reported as a matter of routine. It is presently supplied by a software default in most analyses, and it determines both the effective n and the population to which the inference applies.
9. Conclusion
Service ratings rose following the booking-process change (Wilcoxon signed-rank, Pratt convention: W = 343, p = 4.83e-05, n = 70; matched-pairs rank-biserial r = 0.677), a finding robust to the choice of zero-handling convention and confirmed by a sign test. The practical magnitude is moderate: 46% of customers rated the service higher, 44% unchanged, 10% lower, with the top-two-box share rising from 41% to 56%. The absence of a control group precludes attributing the improvement to the process change.
References
- Wilcoxon, F. (1945). Individual comparisons by ranking methods. Biometrics Bulletin, 1(6), 80–83.
- Pratt, J. W. (1959). Remarks on zeros and ties in the Wilcoxon signed rank procedures. Journal of the American Statistical Association, 54(287), 655–667.
- Conover, W. J. (1973). On methods of handling ties in the Wilcoxon signed-rank test. Journal of the American Statistical Association, 68(344), 985–988.
- Kerby, D. S. (2014). The simple difference formula: an approach to teaching nonparametric correlation. Comprehensive Psychology, 3, 11.IT.3.1.
- Jamieson, S. (2004). Likert scales: how to (ab)use them. Medical Education, 38(12), 1217–1218.
- Campbell, D. T., & Stanley, J. C. (1963). Experimental and Quasi-Experimental Designs for Research. Rand McNally.
- Hollander, M., Wolfe, D. A., & Chicken, E. (2014). Nonparametric Statistical Methods (3rd ed.). Wiley.
Reproducibility
The dataset (capstone-service-ratings-before-after.xlsx) and an executable notebook reproducing every statistic, table, and figure, including all three zero conventions, accompany the chapter. Analyses use NumPy, pandas, SciPy, and Matplotlib.