Every capstone so far studied one factor at a time. But the world rarely varies one thing at a time, and when two factors act together the interesting question is usually not "does A matter" or "does B matter" but does A matter more when B is high? That question has a name, the interaction, and only a factorial design can answer it.
- Setting
- A greenhouse trial crossed two fertilizers (Standard, Premium) with three light levels (Low, Medium, High), growing twelve plants in each of the six combinations and measuring growth in centimeters.
- The question
- Does fertilizer matter, does light matter, and does the effect of fertilizer depend on the light level?
- Why it matters
- The grower has to issue one purchasing recommendation. If Premium only pays off under bright light, a blanket recommendation wastes money in every low-light house.
- What we do
- Run a two-way ANOVA, read the interaction before either main effect, check the model's assumptions, and turn the result into three separate decisions instead of one verdict.
Both factors are significant, but the headline is the interaction (F(2, 62) = 9.74, p = 0.0002). Premium fertilizer is not better at low light (−1.05 cm, p = 0.53), only marginally better at medium light (+2.31 cm, p = 0.08), and clearly better at high light (+7.68 cm, p < 0.001). "Premium fertilizer increases growth" is true on average and misleading in practice.
Three Questions in One Design
A greenhouse trial crossed two fertilizers (Standard, Premium) with three light levels (Low, Medium, High), growing twelve plants in each of the six combinations and measuring growth in centimetres. Crossing the factors lets one experiment answer three questions instead of two.
| Null hypothesis | What it claims |
|---|---|
| Fertilizer (main effect) | The two fertilizers give the same mean growth, averaging over light. |
| Light (main effect) | The three light levels give the same mean growth, averaging over fertilizer. |
| Interaction | The effect of fertilizer is the same at every light level. |
That third hypothesis is what a factorial design buys. Running two separate one-way ANOVAs would answer the first two questions and never ask the third, which in this dataset turns out to be the only one that matters for a recommendation.
Clean It, Then Read the Cells
Both factor labels arrived inconsistently cased, so they were standardized first; then duplicate rows, missing values, and impossible growth measurements (a −3 cm and a 250 cm) were removed, taking 74 rows to 68. With a factorial design the thing to read is not the margins but the six cell means.
| Light | Standard | Premium | Premium advantage |
|---|---|---|---|
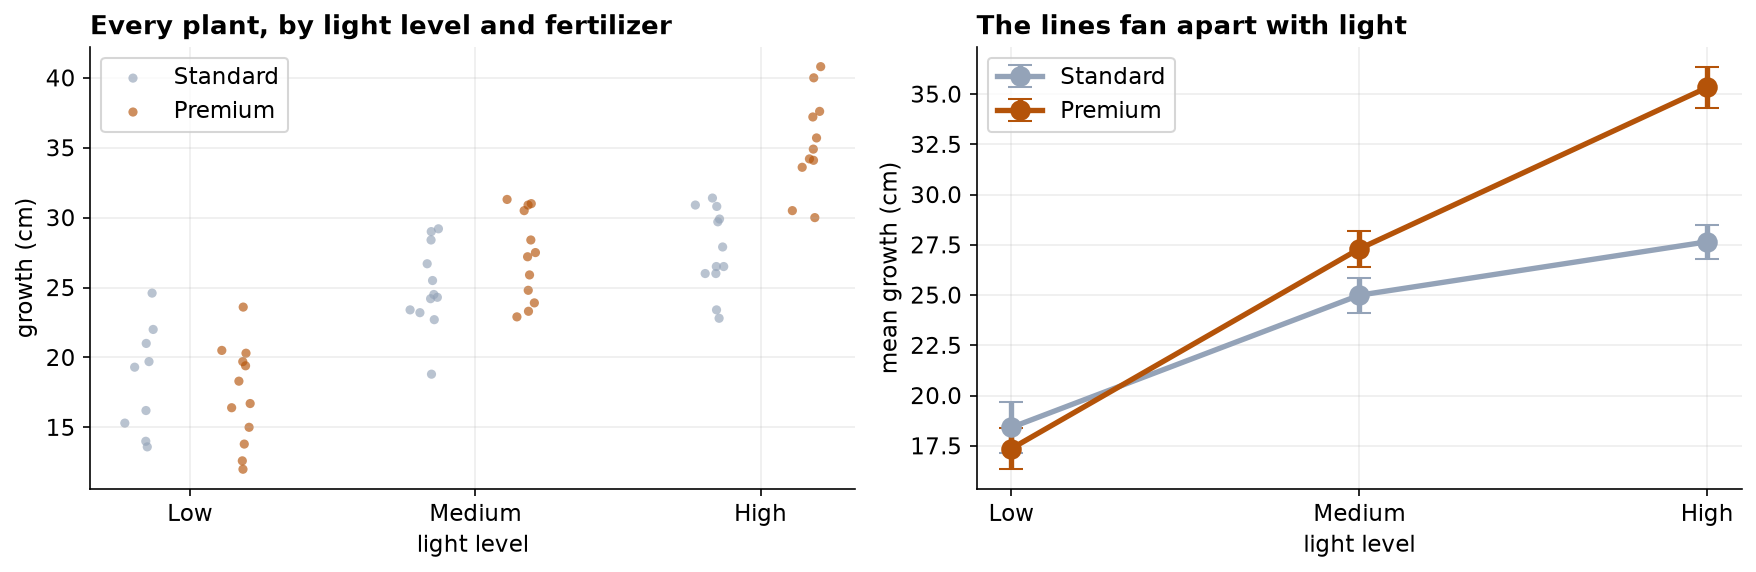
| Low | 18.41 (n=9) | 17.36 (n=12) | −1.05 cm |
| Medium | 24.99 (n=12) | 27.30 (n=12) | +2.31 cm |
| High | 27.65 (n=12) | 35.33 (n=11) | +7.68 cm |
Read down the last column. The Premium advantage is not a constant: it is slightly negative at low light, small at medium, and large at high. The gap grows with light, and a gap that changes is precisely what an interaction is.
What an Interaction Looks Like
The essential picture for a factorial design is the interaction plot: one line per level of one factor, drawn across the levels of the other. The shape of those lines tells you the answer before any test does.
Check the Model's Assumptions
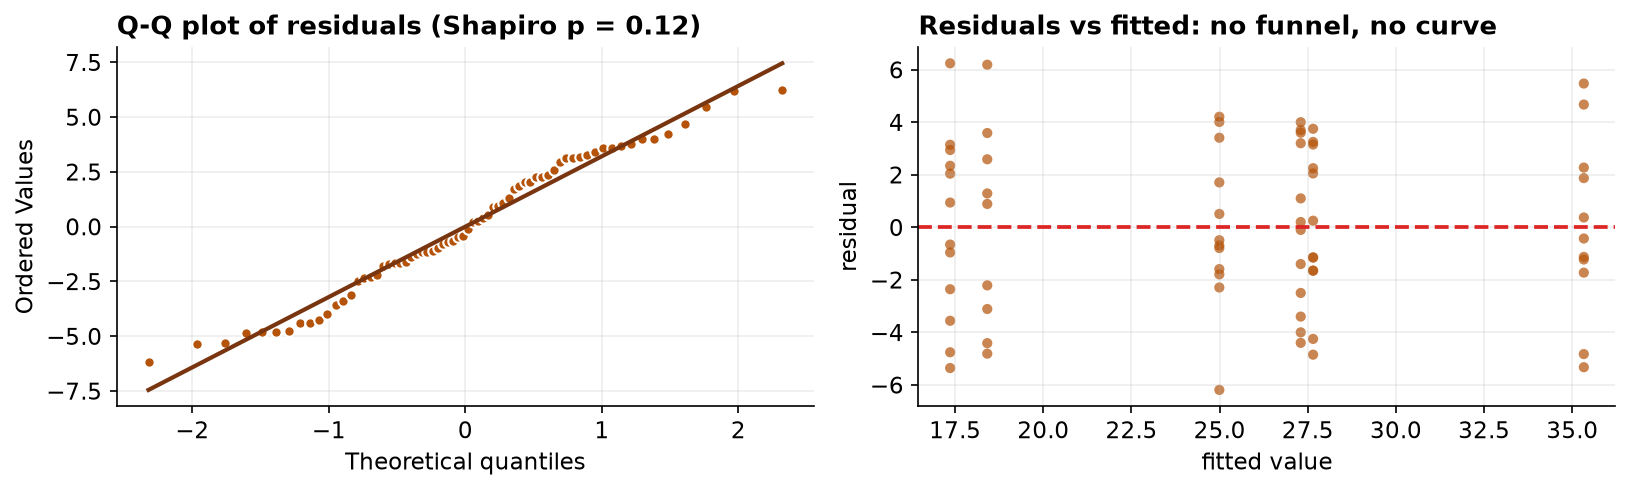
A factorial ANOVA asks for the familiar two conditions, applied to the fitted model: residuals roughly normal, and similar variance across all six cells. We fit the model first, then examine what it leaves behind.
| Assumption | Check | Result |
|---|---|---|
| Normality of residuals | Shapiro-Wilk | W = 0.972, p = 0.12 |
| Equal variance | Levene across all 6 cells | W = 0.341, p = 0.89 |
| Independence | design: one plant per cell, no repeats | satisfied |
Read the Interaction First
This is the rule that makes factorial analysis different: look at the interaction before the main effects. If it is significant, "the effect of fertilizer" is not a single number, and the main effect that claims to be one becomes a weighted average of several different effects.
| Term | F | df | p | Partial η² |
|---|---|---|---|---|
| Light (main effect) | 96.50 | 2, 62 | < 0.001 | 0.757 |
| Fertilizer (main effect) | 14.96 | 1, 62 | 0.0003 | 0.194 |
| Fertilizer × Light | 9.74 | 2, 62 | 0.0002 | 0.239 |
The interaction is significant, so we report simple effects: the fertilizer contrast computed separately within each light level. This is the only honest way to describe what the fertilizer does.
| Light level | Premium − Standard | 95% CI | p | Cohen's d | Verdict |
|---|---|---|---|---|---|
| Low | −1.05 cm | [−4.52, +2.41] | 0.53 | −0.28 | no benefit |
| Medium | +2.31 cm | [−0.30, +4.92] | 0.08 | +0.75 | not significant |
| High | +7.68 cm | [+4.89, +10.47] | < 0.001 | +2.41 | large benefit |
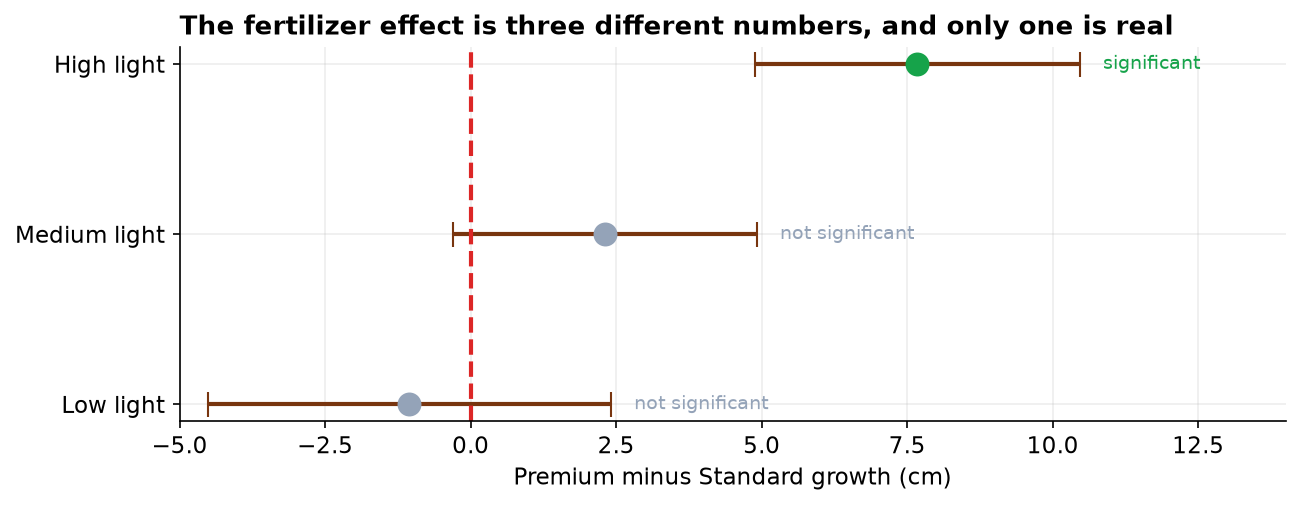
The fertilizer main effect is significant (p = 0.0003), and quoted on its own it would tell a grower that Premium fertilizer works. It is a genuine average, but it averages −1.05, +2.31, and +7.68. No plant in this trial experienced that average. Under a significant interaction, the average effect is a statistic without a referent.
The Verdict and Its Limits
Light dominates growth under either fertilizer, explaining about three quarters of the variation. Fertilizer is conditional: Premium is worth paying for only when light is plentiful. At low light it does nothing measurable, and at medium light its advantage cannot be distinguished from zero at this sample size. The recommendation is therefore not "use Premium" but "use Premium in high-light conditions", which is a different and more useful sentence.
- Do not extrapolate the fan. "High" here is one specific intensity. The pattern suggests the fertilizer needs light to be usable, but it says nothing about intensities beyond the tested range, and extrapolating a fanning pattern is how greenhouse findings turn into bad field advice.
- A greenhouse is not a field. Temperature, water, soil, and pests were uniform here. An effect that depends on light will very plausibly depend on those as well, so this establishes a mechanism rather than a universal recommendation.
- Report the cost alongside the growth. Premium fertilizer presumably costs more. Publishing the average benefit without the condition attached would encourage growers in low-light settings to buy something that demonstrably will not help them, which is a real harm dressed as a statistic.
- Nearly balanced, not perfectly. Cleaning left slightly unequal cell counts, so Type II sums of squares were used. With badly unbalanced designs the sums-of-squares type can change the main-effect tests, and it should be stated rather than left to a software default.
Interactions in Data Science & AI
The idea that an effect depends on context is one of the most transferable in all of statistics, and it reappears under many names.
| Where it appears | The interaction |
|---|---|
| Heterogeneous treatment effects | An experiment helps one segment and not another; the average treatment effect hides both. |
| Full-factorial experiments | Two product changes tested together, to catch the case where each helps alone but not combined. |
| Interaction terms in regression | The same idea in model form: a coefficient on the product of two predictors. |
| Fairness auditing | A model that performs well overall but poorly for one subgroup is an interaction between the model and group membership. |
The single most common misreading of experimental results in industry is quoting an average effect when the effect is conditional. Averages are the right summary only when the effect is roughly constant; when it is not, the average describes no one. The habit this capstone teaches, test the interaction before you trust the average, carries directly into segment analysis and heterogeneous-treatment-effect work, where the modern tools differ but the logic does not.
Estimate: Three Decisions, Not One Verdict
The interaction told us the fertilizer effect depends on light, and the simple effects gave the direction at each level. Intervals give the size, and they turn a statistical finding into something a grower can act on.
| Light level | Premium minus Standard | 95% confidence interval | Buying advice |
|---|---|---|---|
| Low | −1.05 cm | −4.52 to +2.41 | do not pay for it |
| Medium | +2.31 cm | −0.30 to +4.92 | unresolved |
| High | +7.68 cm | +4.89 to +10.47 | premium pays |
Under high light, premium fertilizer adds between about 4.9 and 10.5 cm, so it pays and the only question is how much. Under low light the interval is compatible with premium being slightly worse. Buy premium for the bright benches; do not buy it for the dim ones. No single averaged number could carry that message, which is exactly why reading the main effect first would have been the wrong move.
The One Capstone Where "Caused" Is the Right Word
Almost every chapter in this part ends by warning against causal language. This one does not, and the reason is worth being explicit about, because the difference lies in the design rather than in the statistics.
In Capstone 11 we measured study hours as students happened to report them, so a correlation could reflect hours causing scores, ease causing hours, or prior ability causing both. Here the experimenter set the light level and the fertilizer. Plants did not choose the bright bench, and a plant's own vigor cannot have influenced which treatment it received.
That single design feature closes off the alternatives. Reverse causation is impossible, since growth cannot reach back and change the fertilizer applied last month. Confounding is handled by allocation, since any pre-existing difference between plants is scattered across the six cells rather than lining up with treatment. Everything else was held constant by the greenhouse.
So this chapter may say caused, and it should. The point is not that experiments are better analyses. The statistics here are no more sophisticated than in the observational capstones and in places they are simpler. The point is that causal claims are earned in the design, before any data are collected, and no amount of careful analysis afterwards can substitute for them.
The full project, step by step
The companion notebook runs all twelve framework steps: it standardizes both factor labels and cleans the file
with a printed audit trail, tabulates the six cell means, draws the interaction plot, fits the factorial model
with statsmodels, checks residual normality and equal variance across cells, reads the ANOVA table
interaction-first with partial eta-squared for every term, and computes the simple effects within each light
level. Every number here comes from its output, with a plain-language note after each result.
The dataset (capstone-plant-growth-two-factors.xlsx) holds
the trial on the plants sheet, with a codebook and notes, and it keeps the inconsistent labels, blanks,
duplicates, and impossible values so you can practice the cleaning. Two written reports accompany it: a
plain-language brief for a grower, and a technical report with the full factorial
ANOVA table, simple-effects analysis, diagnostics, and references.
🎓 Key Takeaways
- ✓A factorial design asks a third question: not just whether each factor matters, but whether the effect of one depends on the other.
- ✓Read the interaction first. Here it was significant (F(2, 62) = 9.74, p = 0.0002, partial η² = 0.24), which changes how the main effects may be used.
- ✓Parallel lines mean no interaction; lines that fan or cross mean the effect is conditional. This interaction plot fans.
- ✓Report simple effects: Premium fertilizer gave −1.05 cm at low light (p = 0.53), +2.31 at medium (p = 0.08), and +7.68 at high (p < 0.001).
- ✓A significant main effect can describe no one: the fertilizer average pooled −1.05, +2.31, and +7.68, a value no plant in the trial experienced.
Quiz: Test Yourself
Eight questions on this capstone, from interaction plots to simple effects. Answer them, hit Check Answers, and keep refining until you score 100%. Your progress is saved.