The previous capstone had 182 respondents. This one has twelve products, because that is what a tasting panel can get through before the palate stops cooperating. Small samples are not a lesser kind of data; they are a different problem, and this chapter is as much about what twelve items can support as about the coefficient itself.
- Setting
- Three trained judges independently scored the same twelve products on a 1-to-10 quality scale, blind to brand.
- The question
- Do the judges put the products in the same order?
- Why it matters
- The panel's verdict is about to decide which products the company carries. If the judges are not ordering products the same way, the verdict is an artifact of who happened to sit on the panel.
- What we do
- Measure Kendall's tau for each pair of judges, add Kendall's W for the panel as a whole, test against a permutation null because twelve products rule out large-sample approximations, and examine a tau of 0.32 that means nothing.
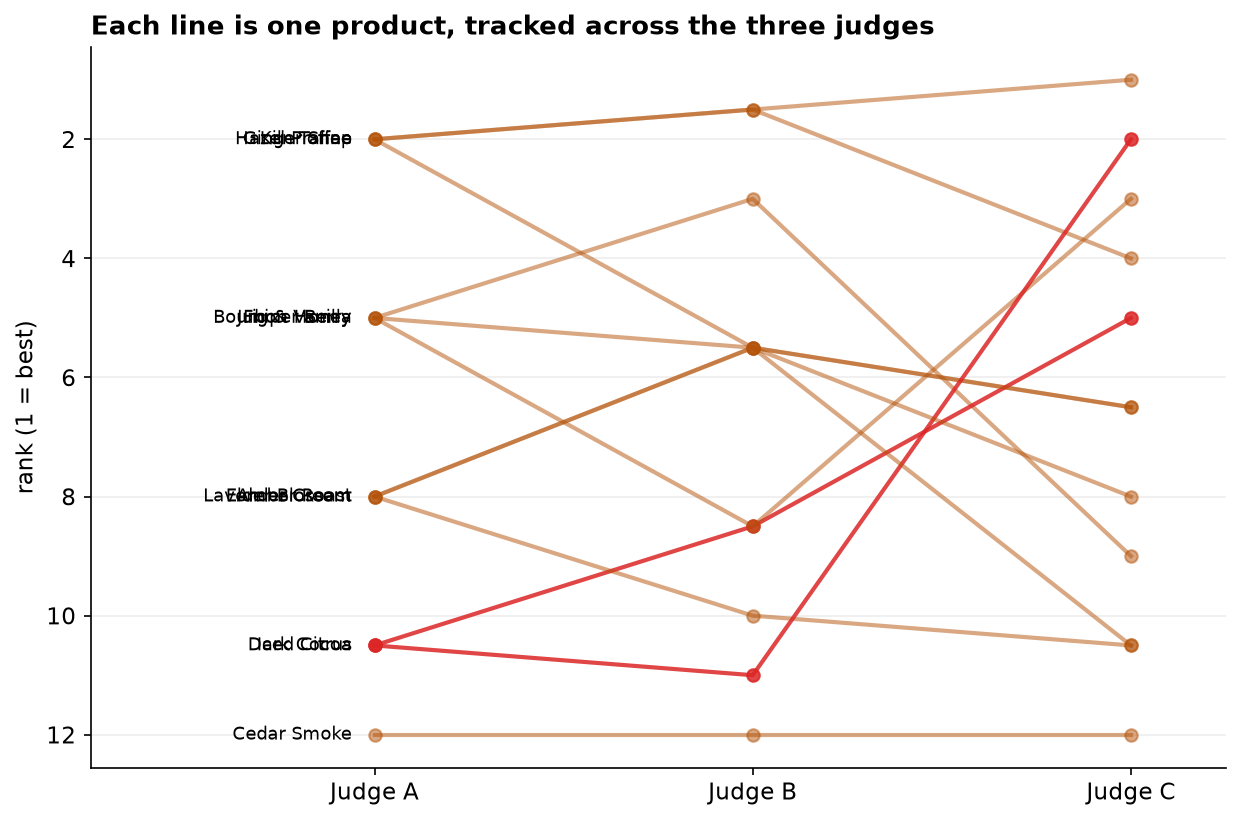
Judges A and B agree substantially on the order of the twelve products (τb = 0.74, p = 0.002). Judge C does not: τb = 0.32 against A, which sounds moderate and means nothing, because with twelve products chance alone produces a tau that large about one time in five.
The Panel, and the Right Question to Ask of It
Three trained judges scored the same products independently on a 1-to-10 quality scale, blind to the brand. Before the panel's verdict goes anywhere near a product decision, someone should ask whether the judges are measuring the same thing at all.
Note carefully what that question is not. It is not whether the judges gave similar scores. One judge may be systematically harsher than another, marking everything two points lower, and still rank every product identically. For a decision about which products to carry, that is agreement enough. The question is about order.
Each judge's score is ordinal: ordered, but with no guarantee that the step from 7 to 8 means the same as the step from 3 to 4. The unit of analysis is the product, and there are twelve. Ordinal measurement rules out the product-moment correlation on the same grounds as Capstone 12; a sample of twelve rules out leaning on any large-sample approximation. Both point to a rank method, and specifically to one that behaves well when n is small.
What the Judges Saw
The raw sheet held 16 rows. One was a duplicate submission, two were products a judge never tasted, and one carried an impossible score of 12 on a 10-point form. Twelve products survive with a complete set of three scores.
Scores are not the interesting object; ranks are. Converting each judge's scores to ranks and joining the same product across judges turns agreement into flat lines and disagreement into crossings.
What Tau Actually Counts
Most coefficients have to be explained by analogy. Tau can be explained by doing it. Take any two products and ask a single question of each judge: which one is better? If both judges answer the same way, the pair is concordant. If they answer differently, it is discordant. If either judge gave the two products the same score, the pair is tied and carries no information about agreement.
Twelve products make 66 pairs. Here is how they fell.
| Pairs of products, Judge A against Judge B | Count | Contributes |
|---|---|---|
| Concordant · both judges agree which is better | 46 | +1 each |
| Discordant · the judges disagree | 4 | −1 each |
| Tied by Judge A only | 8 | nothing |
| Tied by Judge B only | 6 | nothing |
| Tied by both judges | 2 | nothing |
| Total pairs | 66 | — |
Divide the excess of agreements over disagreements by all 66 pairs and you get tau-a = (46 − 4) / 66 = 0.636. That version penalizes the coefficient for the 16 tied pairs, treating them as though they were partial disagreements, which they are not. Tau-b removes tied pairs from the denominator separately for each judge, which raises the value to 0.737. On a 10-point scale over twelve products, ties are guaranteed, so tau-b is the version to report.
The Result
Judges A and B agree well, and the agreement is far too strong to be chance. Judge C agrees with neither at a level this panel can detect. It is worth noting one more number: Spearman's rho for the same A-and-B data is 0.817, well above tau-b's 0.737.
They are built differently and live on different scales. Tau counts pair agreements; rho correlates rank numbers. For the same data tau typically lands well below rho, and neither confirms nor contradicts the other. A report should say which coefficient it is quoting and stay with it, because "the correlation was 0.82" and "the correlation was 0.74" describe the identical panel.
A Tau of 0.32 That Means Nothing
Judge C's 0.317 against Judge A reads like moderate agreement. In a sample of twelve it is indistinguishable from random ordering, and the cleanest way to show that is to make the null hypothesis literal: shuffle one judge's scores at random, compute tau, and repeat twenty thousand times. That is a picture of what agreement looks like when there is none.
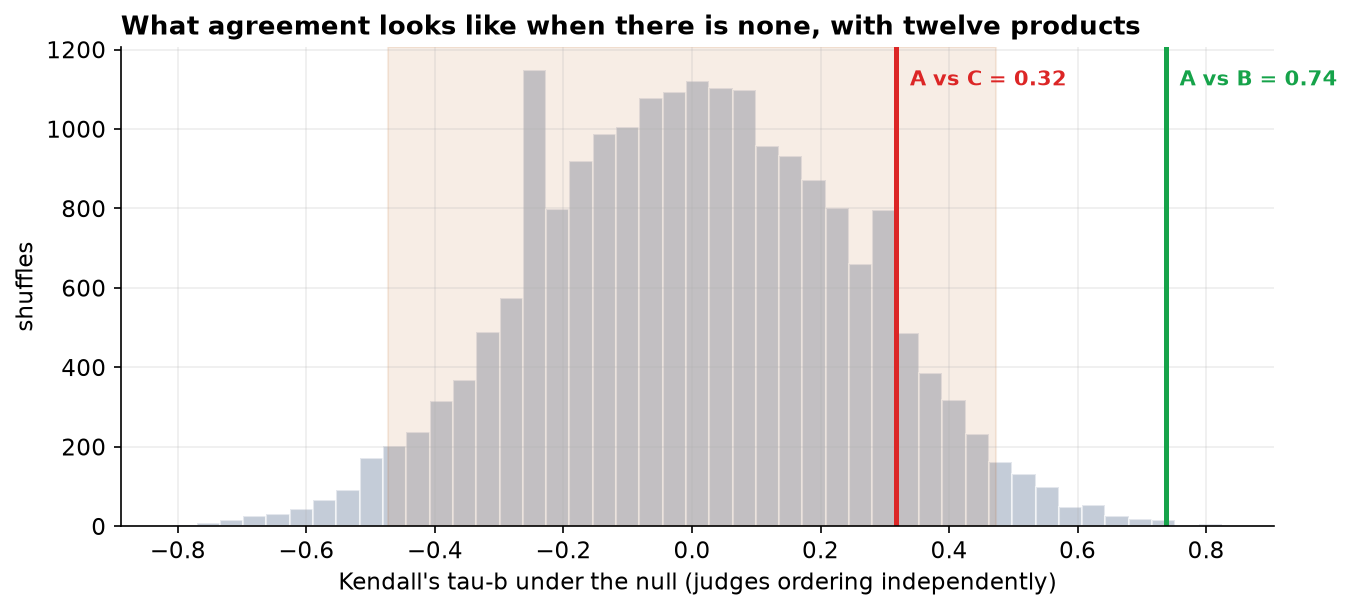
Put concretely: chance produces a tau of 0.32 or larger in 19 percent of shuffles, and a tau of 0.74 or larger in 0.1 percent. That is the difference between the two verdicts, and it has nothing to do with how far apart the two coefficients look.
The Whole Panel at Once: Kendall's W
Tau compares two rankings. With a panel of three or more, the natural summary is Kendall's coefficient of concordance, W, which runs from 0 (no shared ordering at all) to 1 (every judge in perfect agreement).
The panel as a whole shows moderate concordance, enough to reject the idea that all three judges are ordering products independently. But notice what a single panel-level number hides: the pairwise taus showed two judges in close agreement and a third who is not. Report W alone and the panel looks more unified than it is. Report both, and the reader sees the actual structure.
The Verdict, and the Question Statistics Cannot Answer
Judges A and B substantially agree on the order of the twelve products. Judge C does not agree with either at a level this panel can distinguish from random ordering. For the product decision that means the A-and-B consensus is usable, and Judge C's sheet should not simply be averaged in as though it carried equal signal.
The right next step is not statistical. Before discarding anyone, find out why Judge C differs. A judge trained on a different product category, or one who tasted in a different order, or one reading "quality" as commercial appeal rather than craft, produces exactly this pattern for a reason worth knowing. The coefficient tells you there is something to investigate. It does not tell you who is right.
- A dozen products is a dozen products. Every estimate here carries wide uncertainty, as the shuffle test made plain. Quoting tau-b to three decimals invites more confidence than twelve items can support.
- Disagreement is not incompetence. The test measures whether two judges ordered products alike. If Judge C is the only one attuned to a quality the others miss, this analysis would still flag C as the odd one out.
- Order effects and palate fatigue. If every judge tasted in the same sequence, part of the observed agreement is agreement about position on the sheet rather than about the products. Randomizing the order per judge separates the two, and this panel did not record whether that happened, which is a design gap worth closing.
- Blinding is what makes it about the product. Judges who can see the brand are partly scoring the brand.
- Agreement is a panel diagnostic, not a staffing metric. A coefficient computed on twelve products has no business appearing in anyone's performance review.
Rank Agreement in Data Science & AI
The question "do two raters order these the same way?" turns up constantly once you know to look for it, and it is often the question standing between a model and its evaluation.
| Where it appears | The two rankings being compared |
|---|---|
| Inter-rater reliability | Two human annotators labeling the same items on an ordered scale. |
| Search and recommender evaluation | The system's ranking against human relevance judgments. |
| LLM-as-judge validation | A model's graded scores against a human rater's, on the same responses. |
| Preference data for RLHF | Pairwise preferences between model outputs, which is tau's native format. |
| Feature importance stability | The ranking of features from one training run against another. |
Preference learning is built on exactly the comparison tau counts: a rater is shown two outputs and picks one. A dataset of such judgments is a list of concordant and discordant pairs, so tau is the natural measure of how well a reward model reproduces human ordering. The small-sample warning in this chapter transfers directly. An evaluation set of a dozen prompts cannot distinguish a model that mostly agrees with human raters from one that agrees by luck, no matter how confidently the resulting number is reported.
Estimate, and the Small Sample Speaks Again
The permutation test settled whether the agreement could be chance. It did not put a range on how much the judges agree, and with twelve products that range is the most honest thing this analysis can produce.
| Quantity | Estimate | 95% CI (bootstrap) | Width |
|---|---|---|---|
| A vs B, τb | +0.737 | +0.427 to +0.955 | 0.53 |
| A vs C, τb | +0.317 | −0.280 to +0.820 | 1.10 |
| Kendall's W (panel) | 0.662 | 0.310 to 0.903 | 0.59 |
Judge A and B's agreement is somewhere between roughly 0.43 and 0.96. That still rules out "no agreement", which is why the test was significant, but it is a long way from pinning down how closely the two judges track each other. Judge C's interval is wider still and comfortably includes zero.
This is the shuffle test's lesson restated as estimation rather than as a decision. Twelve products can establish that two judges agree; they cannot establish by how much. A panel report quoting "τ = 0.74" without that interval invites a reader to compare it against some other panel's 0.68 and draw a conclusion neither sample could support.
The full project, step by step
The companion notebook cleans the panel sheet with a printed audit trail, draws the rank picture, then counts all 66 pairs by hand before calling a library so that tau's definition is visible rather than asserted. It computes tau-b for each pairing, runs the twenty-thousand-shuffle null distribution that puts a small sample in its place, and closes with Kendall's W across all three judges. Every number in this chapter comes from its output.
The dataset (capstone-judges-product-rankings.xlsx) holds the
panel sheet with all three judges' scores, with a duplicate submission, two untasted products, and an out-of-range
score left in so you can practice the cleaning. Two written reports accompany it: a plain-language
brief for a product lead, and a technical report covering the tie correction, the
permutation test, and the concordance coefficient.
🎓 Key Takeaways
- ✓Tau counts pairs: of 66 pairs of products, the judges agreed on 46 and disagreed on 4, and the remaining 16 involved a tie and carry no information.
- ✓Tau-b is the version to report when ties are inevitable, because tau-a treats tied pairs as though they were partial disagreements (0.636 against 0.737 here).
- ✓Rho and tau are not interchangeable: the same panel gives ρ = 0.82 and τb = 0.74. Say which one you are quoting.
- ✓Twelve items is a wide net for chance: the shuffle test puts the middle 95 percent of null results at roughly ±0.47, so Judge C's 0.32 is unreadable.
- ✓Kendall's W summarizes a whole panel (0.66 here), but report the pairwise taus alongside it or a split panel will look unified.
Quiz: Test Yourself
Eight questions on this capstone, from what tau counts to what a sample of twelve can support. Answer them, hit Check Answers, and keep refining until you score 100%. Your progress is saved.