Catch a model that is 88.7% accurate and misses almost every case
Why it matters
In a published analysis of a national health survey, a model that was 88.7% accurate flagged 805 of 134,897 adults, although about one in nine of them had reported a depressive episode.1 Before you approve a model that looks for something rare, ask for the base rate, the share of real cases it finds and what each kind of mistake costs.
Rare outcomes break the usual defaults, because accuracy rewards a model that never raises an alarm, ROC-AUC flatters one when negatives vastly outnumber positives, and rebalancing the classes keeps the ranking while distorting the probabilities.2 The lab replaces each default with a check you can repeat on your own models.
What you will do
The visual guide and its notebook follow one card issuer through four months of purchases, a scenario written for the book, with 318 frauds among 119,556 transactions.2
- Price each error before fitting a model. A false alarm costs $16 of analyst time and customer annoyance, while a missed fraud costs the amount written off plus $25 of handling.2
- Measure the model that does nothing. Flagging no transaction at all scores 99.73% accuracy, which is why the lab never reports accuracy again.2
- Split the data by time, and catch a warehouse column that lifts PR-AUC from 0.30 to 0.98 although it is filed weeks after each purchase, too late to inform the decision.2
- Compare oversampling, class weights and leaving the data alone. All three rank transactions almost identically, and the first two predict a fraud rate about 36 times the one observed.2
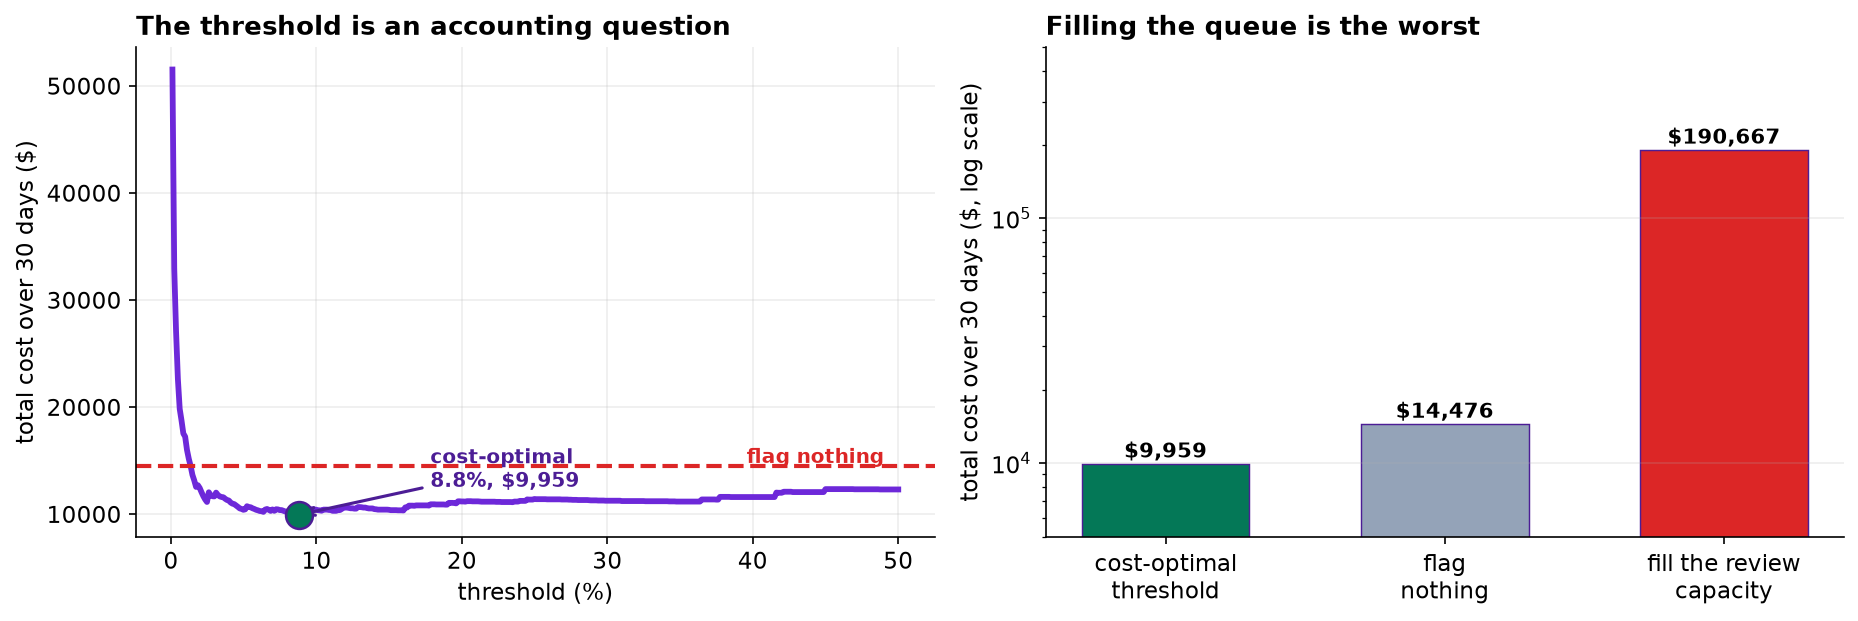
- Set the threshold from the costs, and then test the review team’s capacity. The cheapest policy flags about five transactions a day for 31% less than flagging nothing, and working every case the team could costs 13 times as much as having no model.2
Before you start
You need a free Google account to run the notebook in Colab. It loads its data from the book’s repository, and Colab already has pandas, scikit-learn and matplotlib, so there is nothing to install, no API key and no cost. Every cell runs as written, and a little pandas helps if you want to change the code.
Articles it puts into practice
88.7% accurate and missing almost every case reads the survey model at five cut-offs and lists the numbers to ask for beside accuracy.
Found this useful? Follow me on LinkedIn for the next one.
Working on this? Connect and tell me what you are seeing.