Mechanism, Method and Coverage in a Survey with 51 Percent Incomplete Records
Four missing-data methods scored against known removed values, bias and interval coverage over 150 replications, and a delta-adjustment sensitivity analysis for a non-ignorable mechanism.
Abstract
Objective. To determine which missing-data method to adopt for a survey in which 51.2 percent of records are incomplete, and to establish whether either of two estimands is recoverable.
Design. Gaps were imposed on a complete extract under three mechanisms, so the removed values are available for scoring. Activity minutes were made MCAR at 15.5 percent. BMI was made MAR at 31.5 percent through a logistic model in systolic blood pressure and age, that is, dependent on the OUTCOME of the target regression. Income was made MNAR at 17.0 percent through a logistic model in income itself. Four methods were compared: complete-case, unconditional mean imputation, single conditional-mean imputation via iterative chained equations without noise, and proper multiple imputation with m = 20 combined by Rubin's rules. The entire study was then replicated 150 times to estimate bias and 95 percent interval coverage.
Result. The complete-data estimate was 0.980 mm Hg per BMI unit. Over 150 replications, coverage was 96.0 percent for complete data, 82.7 for complete-case, 78.0 for mean imputation, 88.7 for multiple imputation, and 2.7 percent for single conditional-mean imputation, which carried a bias of +0.330 against a between-replication standard deviation of 0.089. Fraction of missing information on the target coefficient was 25.4 percent. For mean income, all three feasible methods returned 59.4k against a true 68.2k; delta-adjustment located a tipping point at 35k.
1. Data and preprocessing
The extract contained 1,406 rows. Six duplicate respondent identifiers were removed. Three sentinel conventions were present and were converted to explicit missingness: -1 in activity minutes (204 rows), 999 in income (143 rows), and the string not measured in BMI (111 rows), the last of which caused the column to be read as object dtype. Naive completeness on the raw file reported 29.6 percent of rows affected; after sentinel conversion the figure was 51.2 percent, leaving 683 complete cases of 1,400.
2. Evidence on the mechanisms
| Column | Missing | Mean SBP when observed | Mean SBP when missing | Mechanism |
|---|---|---|---|---|
| Activity | 14.4% | 134.3 | 134.9 | MCAR |
| BMI | 31.5% | 131.0 | 141.7 | MAR, on the outcome |
| Income | 17.0% | — | — | MNAR |
Respondents missing BMI averaged 10.7 mm Hg higher systolic pressure and were 7.7 years older, both observed, so the mechanism is MAR. It is nonetheless the case that complete-case analysis is biased here, because the missingness depends on the regression outcome rather than only on covariates. For income, the true mean among non-responders was 110.9k against 59.4k among responders, a fact available only from the retained values.
3. Single-dataset estimates
| Method | Estimate | SE | 95% CI |
|---|---|---|---|
| Complete data | 0.980 | 0.055 | 0.872 to 1.087 |
| Complete-case, n = 683 | 0.874 | 0.077 | 0.724 to 1.025 |
| Mean imputation | 0.895 | 0.072 | 0.753 to 1.037 |
| Single regression imputation | 1.324 | 0.063 | 1.200 to 1.448 |
| Multiple imputation, m = 20 | 0.954 | 0.066 | 0.826 to 1.083 |
Three of the four feasible intervals contain the complete-data estimate on this realization, which is why a single dataset cannot discriminate between methods. Single regression imputation is both the furthest from the target and the narrowest of the methods using all n, having imputed BMI from a model containing the outcome and then analyzed the imputations as observations.
4. Bias and coverage over 150 replications
| Method | Mean estimate | Bias | SD | Coverage |
|---|---|---|---|---|
| Complete data | 0.901 | +0.001 | 0.059 | 96.0% |
| Complete-case | 0.822 | -0.078 | 0.077 | 82.7% |
| Mean imputation | 0.814 | -0.086 | 0.071 | 78.0% |
| Single regression imputation | 1.230 | +0.330 | 0.089 | 2.7% |
| Multiple imputation, m = 6 | 0.882 | -0.018 | 0.073 | 88.7% |
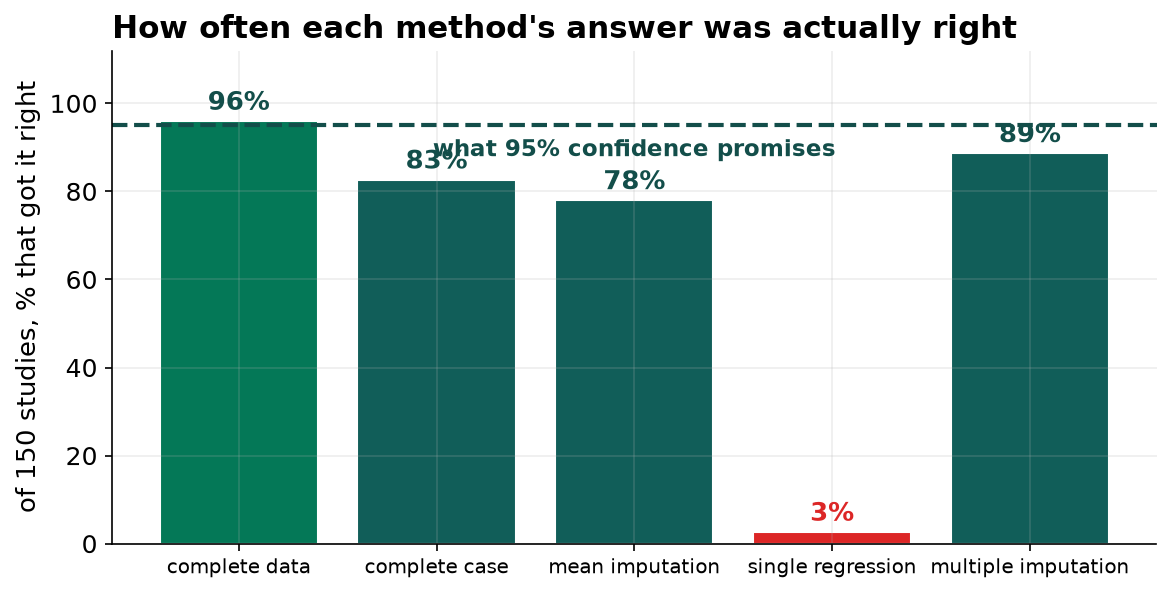
Mean imputation attenuates through variance reduction in the imputed covariate. Complete-case is biased downward because selection operates on the outcome. Single conditional-mean imputation is biased upward because the imputation model conditions on the outcome and contributes no imputation variance, producing intervals that are simultaneously displaced and too narrow. Multiple imputation retains a residual bias of -0.018 and coverage of 88.7 percent, attributable to the MNAR income covariate, which no MAR-based procedure can address.
5. A non-ignorable estimand
| Method | Mean household income | Grant eligibility below $65k |
|---|---|---|
| Complete-case | 59.40k | qualifies |
| Mean imputation | 59.40k | qualifies |
| Multiple imputation, m = 20 | 59.42k | qualifies |
| Complete data | 68.16k | does not qualify |
A delta-adjustment was applied to the imputed income values, shifting each non-responder's imputation by a constant delta and recomputing the mean. With a 17.0 percent non-response rate the estimate rises by 0.17 per unit of delta, crossing the eligibility threshold at delta = 35k. The retained values imply an actual delta near 52k, 1.5 times the tipping point. The reportable quantity is the tipping point.
6. Limitations
The replication study is conditional on this data-generating process, these missingness rates and this imputation specification; the ordering of methods is not guaranteed to transfer, although the mechanism behind the single-imputation failure is general. The MAR assumption supporting the BMI estimand is untestable outside this constructed setting. Every arm used the same imputation model specification, so the comparison is not sensitive to misspecification of that model. Multiple imputation was run at m = 6 in the replication study for tractability against m = 20 in the primary analysis, which slightly understates its coverage.