Retention, Rotation, Reliability and Whether the Weights Matter
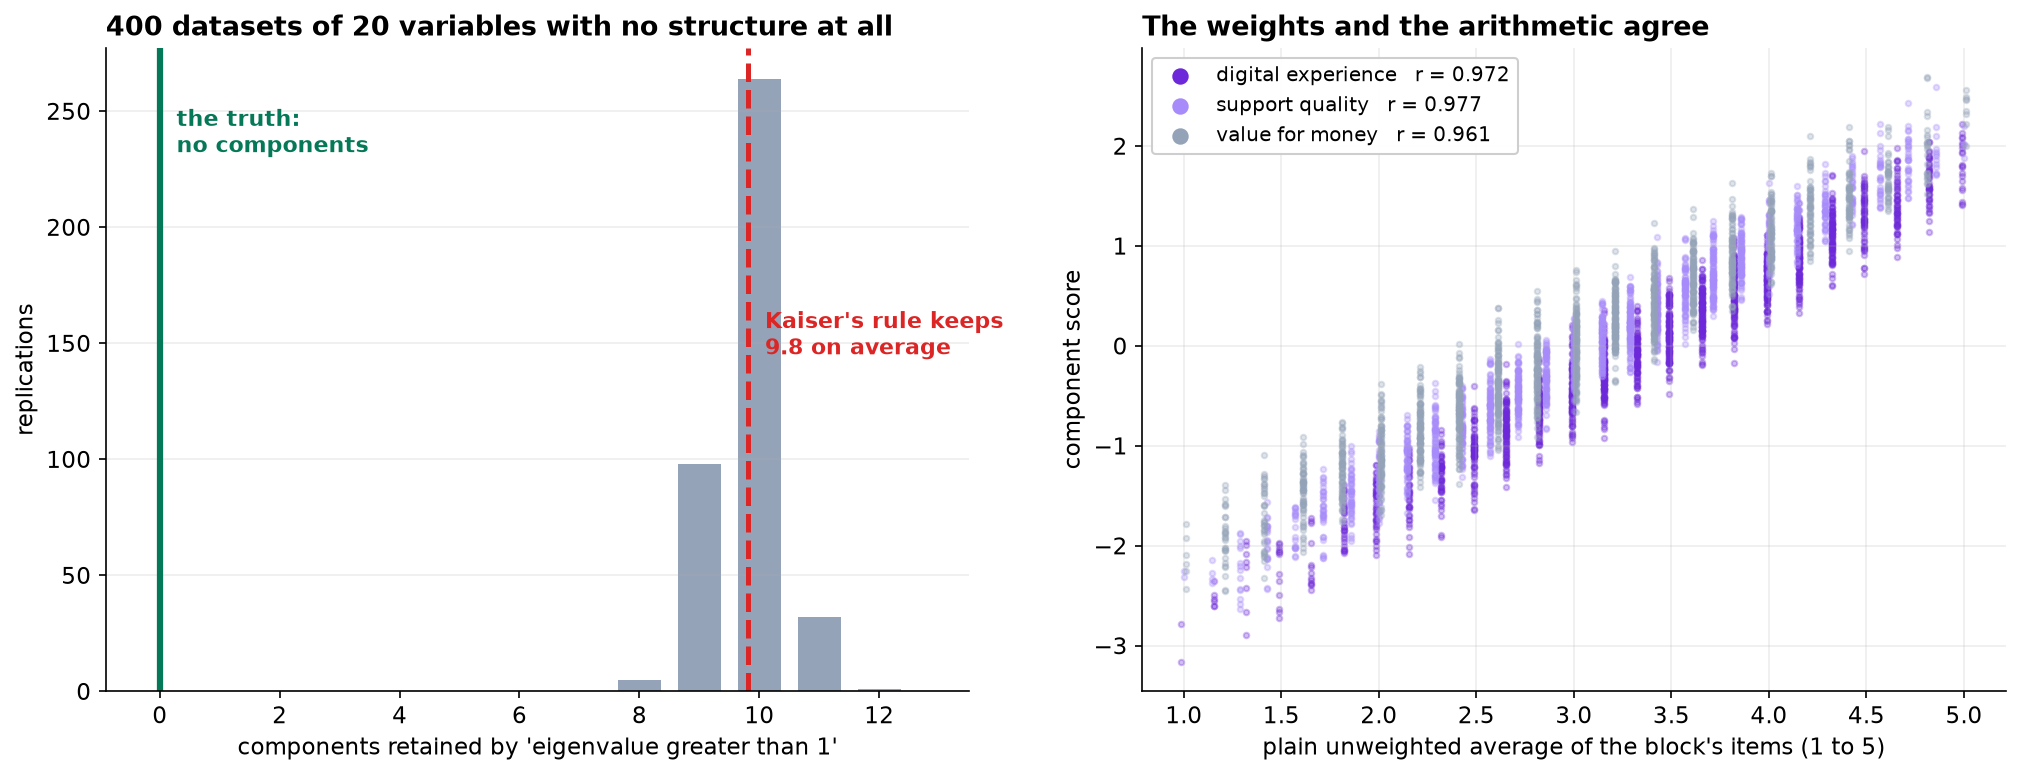
Kaiser's rule retains 9.8 components from twenty variables with no structure. Parallel analysis retains three here. Unit weights then reproduce the component scores above r = 0.96.
1. Sample and preparation
From 1,896 exported responses: a duplicated block of 46 removed on respondent_id; 173 responses carrying at least one item coded 99 ('prefer not to say') removed; 49 straight-liners, respondents whose twenty responses had zero variance, removed. Analysis sample 1,628.
The straight-liner exclusion is not cosmetic. A zero-variance response vector is perfectly consistent with every other zero-variance vector, and the entire analysis is a function of the correlation matrix.
Four items (q05, q11, q13, q17) are negatively worded and were reverse-scored as 6 minus the response before any analysis.
2. Number of components
| Component | Eigenvalue | Variance | Noise 95th percentile | Retain |
|---|---|---|---|---|
| 1 | 6.174 | 30.9% | 1.235 | yes |
| 2 | 2.559 | 12.8% | 1.189 | yes |
| 3 | 2.178 | 10.9% | 1.159 | yes |
| 4 | 0.952 | 4.8% | 1.135 | no |
| 5 | 0.659 | 3.3% | 1.112 | no |
The three rules in common use behave differently. Kaiser's eigenvalue-greater-than-one retains three here but came within 0.048 of retaining a fourth. The scree sequence (6.17, 2.56, 2.18, 0.95, 0.66) admits an elbow at two or at four. Parallel analysis retains three and rejects the fourth by 0.183.
A direct demonstration of the Kaiser problem: across 400 replications of twenty uncorrelated variables at n = 1,628, the rule retained a mean of 9.8 components (range 8 to 12). Sample eigenvalues scatter around 1 under the identity, so roughly half exceed it. The cutoff is the mean eigenvalue, not a test statistic. Parallel analysis is the sampling-aware form of the same comparison.
Three components account for 54.6 percent of the total item variance.
3. Rotation
Unrotated, 19 of 20 items load above 0.30 on the first component, which is the usual general factor that arises whenever all correlations are positive. Varimax rotation of the three retained components leaves the variance explained at 54.6 percent, unchanged by construction, and reduces the number of items loading above 0.30 on more than one component from many to two.
Rotation is a change of basis within a subspace fixed by the data. It has no effect on fit and constitutes no discovery; it should be described to non-technical readers as a readability step.
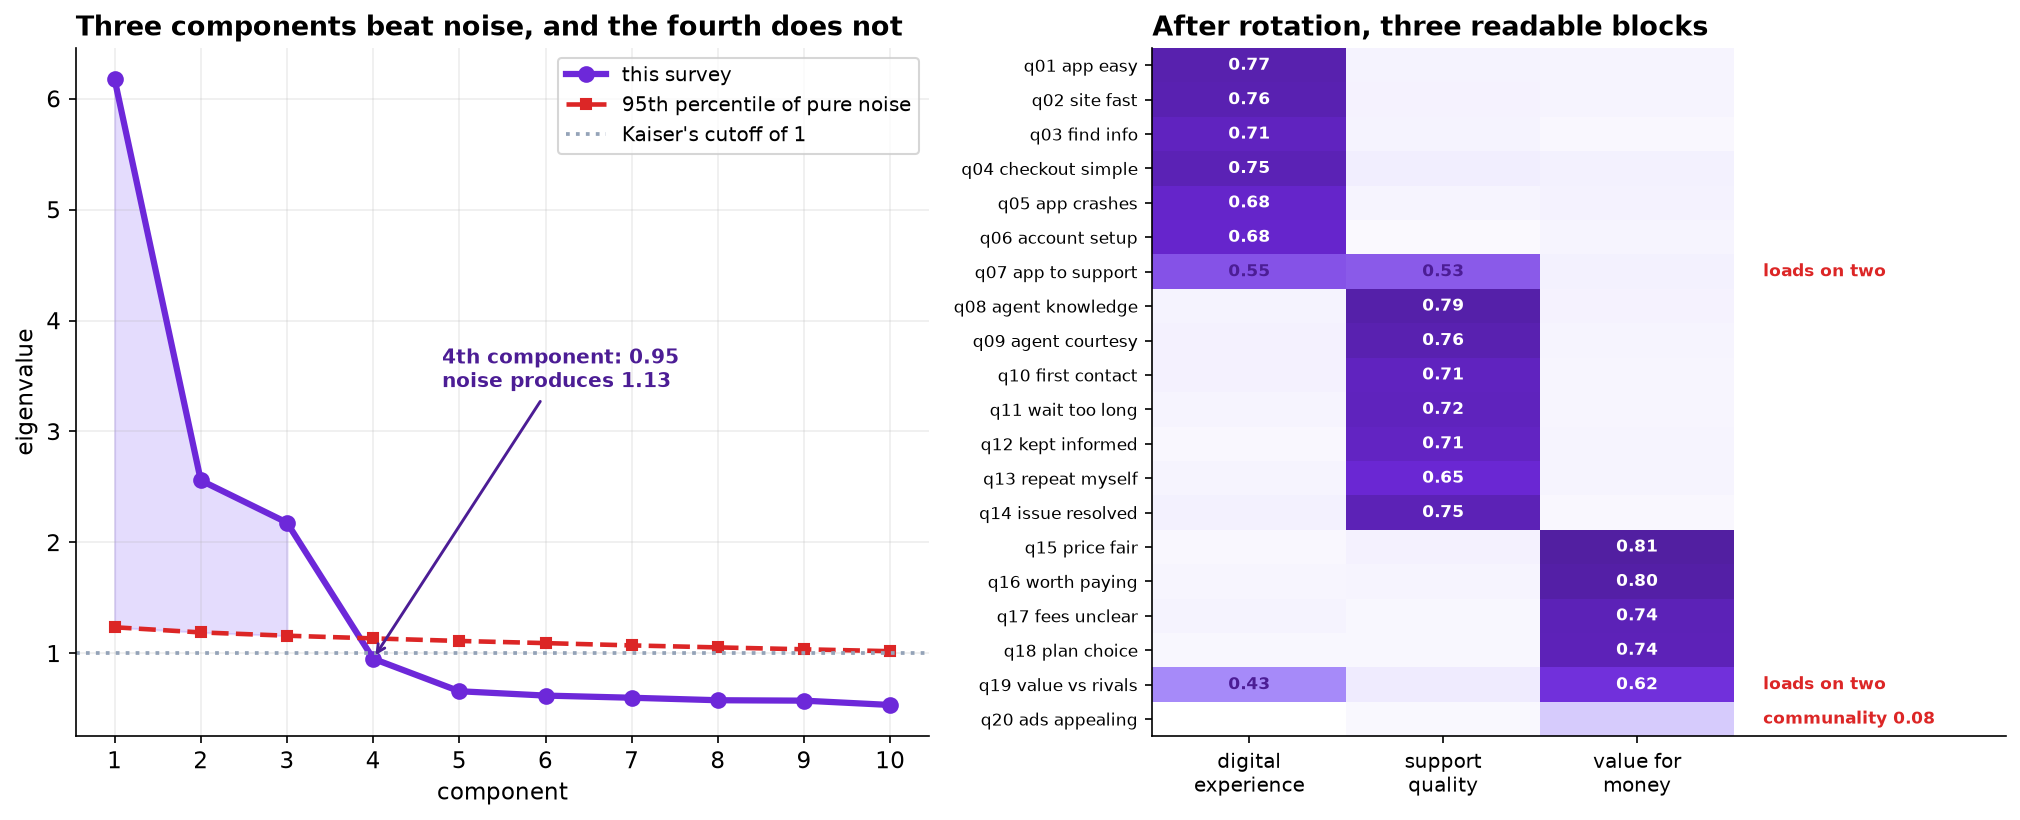
4. Rotated loadings
| Item | Digital | Support | Value | Communality |
|---|---|---|---|---|
| q01 app easy | 0.77 | 0.62 | ||
| q02 site fast | 0.76 | 0.60 | ||
| q03 find info | 0.71 | 0.53 | ||
| q04 checkout simple | 0.75 | 0.60 | ||
| q05 app crashes (reversed) | 0.68 | 0.49 | ||
| q06 account setup | 0.68 | 0.47 | ||
| q07 app to support | 0.55 | 0.53 | 0.60 | |
| q08 agent knowledge | 0.79 | 0.64 | ||
| q09 agent courtesy | 0.76 | 0.61 | ||
| q10 first contact | 0.71 | 0.54 | ||
| q11 wait too long (reversed) | 0.72 | 0.54 | ||
| q12 kept informed | 0.71 | 0.51 | ||
| q13 repeat myself (reversed) | 0.65 | 0.45 | ||
| q14 issue resolved | 0.75 | 0.58 | ||
| q15 price fair | 0.81 | 0.68 | ||
| q16 worth paying | 0.80 | 0.65 | ||
| q17 fees unclear (reversed) | 0.74 | 0.57 | ||
| q18 plan choice | 0.74 | 0.56 | ||
| q19 value vs rivals | 0.43 | 0.62 | 0.60 | |
| q20 ads appealing | 0.08 |
q07 and q19 cross-load and are excluded from the indices rather than assigned to the larger of their two loadings. q20 has a communality of 0.08 and is excluded entirely. All three exclusions are recorded here because item selection after seeing the results is the mechanism by which a battery is tuned toward a desired conclusion, and the defense against it is a written record rather than a rule.
5. Reliability
| Index | Items | Alpha (reverse-scored) | Alpha (raw) | Correlation with the overall item |
|---|---|---|---|---|
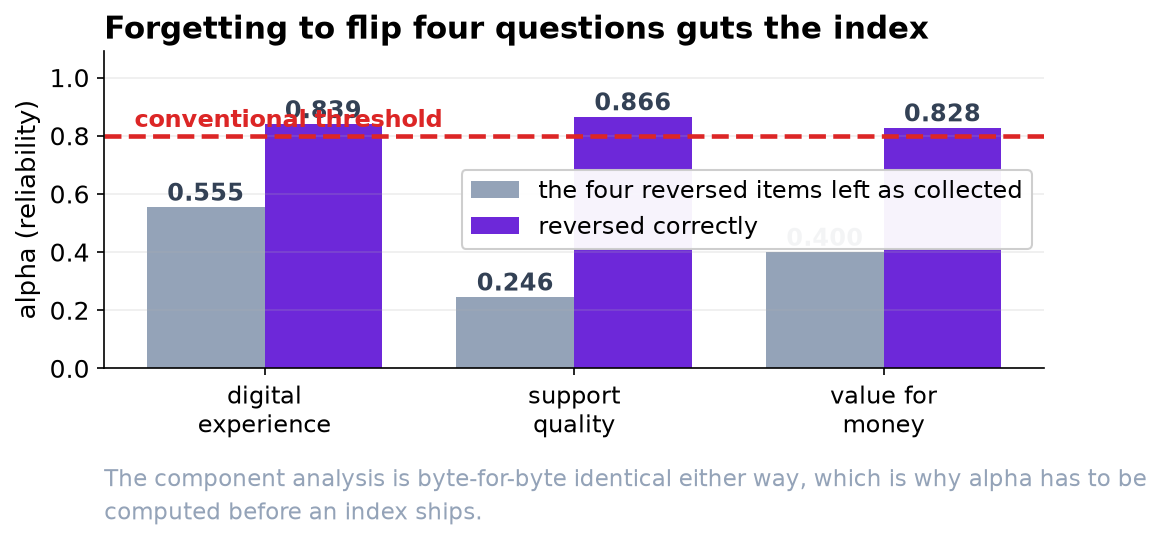
| Digital experience | 6 | 0.839 | 0.555 | +0.545 / +0.488 |
| Support quality | 7 | 0.866 | 0.246 | +0.587 / +0.470 |
| Value for money | 4 | 0.828 | 0.400 | +0.532 / +0.489 |
| All twenty as one scale | 20 | 0.877 |
Two points. First, reverse-scoring has no effect whatever on the eigenvalues: reversing an item multiplies its column by minus one, a similarity transformation of the correlation matrix. The retention decision, the rotation and the block structure are all identical either way, and the only symptom is negative loadings on four rows. Alpha, by contrast, collapses. Alpha is therefore the diagnostic that detects the error, and the component analysis is not.
Second, the twenty items treated as a single scale yield alpha = 0.877, exceeding two of the three block alphas, on a battery demonstrably measuring three things. Alpha increases with item count largely independently of dimensionality and should not be cited as evidence of unidimensionality.
6. Unit weights against estimated weights
| Index | Correlation between component score and unweighted mean |
|---|---|
| Digital experience | 0.9722 |
| Support quality | 0.9769 |
| Value for money | 0.9613 |
| Predictor set | Overall satisfaction R² | Would recommend AUC |
|---|---|---|
| Three component scores | 0.5696 | 0.7609 |
| Three unweighted averages | 0.5610 | 0.7605 |
| All twenty items separately | 0.5656 | 0.7552 |
The three predictor sets differ by 0.009 in R-squared and 0.006 in AUC. Retaining all twenty items and allowing a model to weight them freely does not outperform three unweighted averages. This reproduces the standard unit-weights result: where items are positively correlated with loadings of similar magnitude, equal weighting matches estimated weighting on out-of-sample prediction.
The operational conclusion is to deploy unweighted averages. The analytical conclusion is that the component analysis was still required, since it is what identified the three-block structure, the item assignments and the three exclusions. Dimension reduction was necessary as an investigation and unnecessary as a pipeline.
7. Limitations
PCA is not factor analysis. Components are weighted sums of observed items chosen to maximize captured variance; a common-factor model treats items as noisy indicators of latent constructs with item-specific error terms. For index construction the two agree closely at these communalities. For any claim about a latent construct as a cause, the factor model is the appropriate object.
Treating five-point ordinal responses as continuous attenuates the correlations, increasingly so with skew. Polychoric correlations would produce somewhat larger loadings. At five categories and mild skew this does not usually change the grouping; at three categories or with strong floor or ceiling effects it can, and the analysis should be repeated on the polychoric matrix if either condition holds in a future wave.
The three-block structure is established on a single wave. It should be confirmed on the next one before the indices are treated as fixed, particularly if items are added or reworded.