Development and Evaluation of a 30-Day Cardiac Risk Score: Discrimination, Calibration and Net Benefit
A demonstration that discrimination metrics are insufficient for threshold-based decisions, with two models of identical AUC and materially different clinical consequences.
Objective. To develop a logistic risk score for major cardiac events within 30 days of emergency presentation with chest pain, and to demonstrate the insufficiency of discrimination metrics for evaluating a score intended to support a threshold-based decision. Methods. Logistic regression on ten pre-decision covariates in 5,809 presentations, validated on 3,129 held out at random with stratification. A second model was constructed by adding a constant to the fitted log-odds, preserving the ordering exactly. Discrimination was assessed by AUC, calibration by the Brier score, the calibration slope and intercept, and a decile plot. The decision threshold was derived from a clinician-specified cost ratio. Net benefit was computed across thresholds against treat-all and treat-none. Results. Event rate 3.94%. Both models attained AUC 0.8097. The calibrated model returned a Brier score of 0.03448, mean predicted risk 3.93% against 3.93% observed, calibration intercept −0.053 and slope 0.980. The shifted model returned Brier 0.03944, mean predicted risk 8.64%, intercept −0.983 and slope 0.980. At the derived threshold of 2.44% the calibrated model admitted 1,305 patients (105 events captured, 18 missed) and the shifted model 2,256 (123 captured, 0 missed), a ratio of 53 additional admissions per additional event against a specified tolerance of 40. Net benefit favored the calibrated model at every threshold examined. Conclusion. AUC is invariant to monotone transformation of predicted risk and cannot detect calibration error. Calibration intercept, threshold derivation and net benefit should be reported as standard.
1. Cohort and data preparation
| Stage | n | Note |
|---|---|---|
| Extract | 9,060 | Executed twice |
| Deduplicated | 9,000 | One record per presentation |
| Valid vital signs | 8,938 | 35 systolic values of 0 and 28 heart rates of 999 voided as device sentinels |
| Training | 5,809 | 3.94% events |
| Held out | 3,129 | 3.93% events, 123 in total |
One hundred and thirty-eight presentations had no troponin assay. These were retained with a missingness indicator and median substitution rather than excluded. The decision to order a high-sensitivity troponin is itself clinically informative, and listwise deletion would restrict the model's applicability to patients already judged to warrant testing, which is not the population the score is intended for.
2. Discrimination is invariant to the level
A second model was constructed as logit(p₂) = logit(p₁) + 0.95. This transformation is strictly monotone and therefore preserves the rank order of predicted risk exactly, with a Spearman correlation of 1.
| Model | AUC | Brier | Mean predicted | Observed | Calibration intercept | Slope |
|---|---|---|---|---|---|---|
| A, as fitted | 0.8097 | 0.03448 | 3.93% | 3.93% | −0.053 | 0.980 |
| B, shifted | 0.8097 | 0.03944 | 8.64% | 3.93% | −0.983 | 0.980 |
The identity of the AUCs is not an artifact of rounding: the statistic is a function of the ordering alone and is mathematically invariant to any strictly increasing transformation of the predicted probabilities. Any evaluation restricted to discrimination is therefore incapable in principle of detecting a calibration error of arbitrary magnitude.
Both models return a calibration slope of 0.980, since the shift preserves the dispersion of the linear predictor. Only the intercept distinguishes them. A model report presenting AUC together with the calibration slope, which is a frequent pairing, would pass model B without remark.
3. Threshold derivation
Under an expected-utility formulation, the threshold probability at which admitting and discharging are indifferent equals the ratio of the cost of a false positive to the sum of the costs of a false positive and a false negative. A clinician-specified ratio of 40 gives a threshold of 1/41 = 0.0244.
| Model | Admitted | Events captured | Events missed | Admission rate |
|---|---|---|---|---|
| A, calibrated | 1,305 | 105 | 18 | 41.7% |
| B, shifted | 2,256 | 123 | 0 | 72.1% |
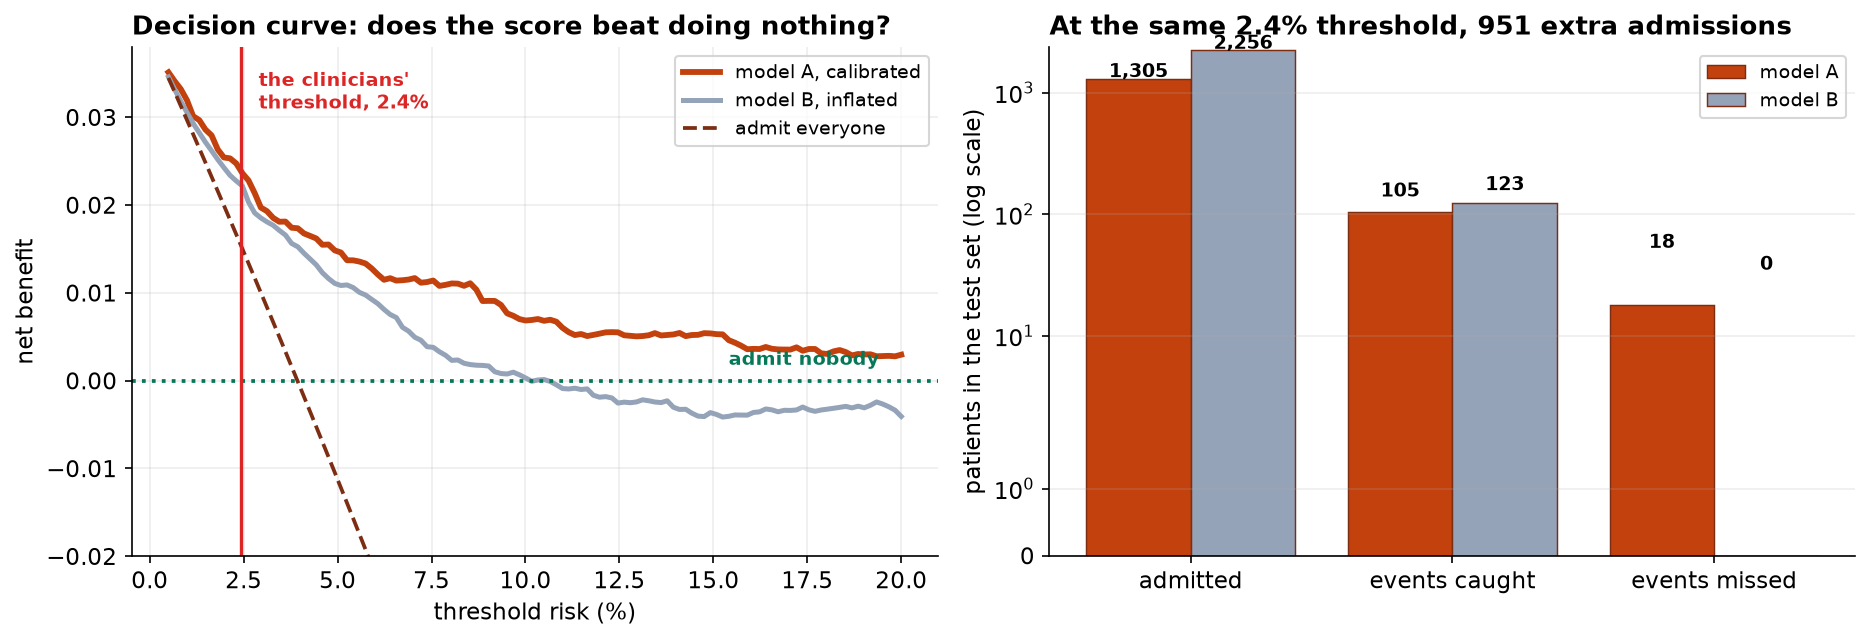
Model B captures 18 additional events at a cost of 951 additional admissions, a marginal exchange rate of 53:1 against a specified tolerance of 40:1. It is not operating more conservatively in a way the clinical team chose; it is operating at a different threshold from the one specified, without that substitution being visible in any reported metric.
It should also be noted that a policy of admitting no patients attains an accuracy of 96.07% on this cohort. Accuracy is not reported elsewhere in this document and should not be reported for outcomes at this prevalence.
4. Net benefit
| Threshold | Model A | Model B | Treat all | Treat none |
|---|---|---|---|---|
| 1.00% | 0.0319 | 0.0305 | 0.0296 | 0 |
| 2.44% | 0.0240 | 0.0223 | 0.0153 | 0 |
| 4.00% | 0.0174 | 0.0148 | −0.0007 | 0 |
| 7.00% | 0.0116 | 0.0052 | −0.0330 | 0 |
| 10.00% | 0.0069 | 0.0003 | −0.0674 | 0 |
| 15.00% | 0.0053 | −0.0037 | −0.1302 | 0 |
Model A dominates model B throughout, and the separation widens with the threshold. Model B attains negative net benefit at 15%, indicating that a decision maker holding that cost ratio would obtain a better expected outcome by disregarding the model entirely. No discrimination metric would disclose this.
5. Specification check
A variable with no relationship to the outcome, month of arrival, was included as a negative control. Held-out AUC changed from 0.8097 to 0.8091 and its fitted coefficient was +0.046 against a true value of zero. In-sample performance necessarily improves with any additional parameter, which is the operative argument for the held-out design specified before fitting.
6. Discussion
The central claim of this report is narrow and, in the applied literature, frequently disregarded. AUC is a rank statistic. A model intended to support a threshold decision is consumed as a probability. The two requirements are distinct, and a model may satisfy the first arbitrarily well while failing the second by an arbitrary margin. The demonstration constructed here is extreme by design, but calibration drift of comparable magnitude arises routinely in practice: from case-mix shift between development and deployment settings, from class rebalancing during training, and from algorithms such as gradient boosting and random forests that are systematically miscalibrated by default while reporting excellent discrimination.
The corresponding recommendation is that calibration intercept and slope, the threshold with the cost ratio from which it was derived, and net benefit against the trivial strategies should appear alongside discrimination in any report on a model intended to support a decision.
Limitations. Performance is reported for the cohort as a whole. A model adequately calibrated in aggregate may be poorly calibrated within subgroups defined by age, sex or ethnicity, and subgroup calibration should be assessed prior to deployment. Validation is internal, using a random split of a single-center cohort; temporal and external validation are required before generalization is claimed. Calibration should be re-assessed at fixed intervals following deployment, since drift is expected rather than exceptional.
7. Conclusion
A logistic risk score attained an AUC of 0.8097 with calibration intercept −0.053 and slope 0.980 on 3,129 held-out presentations. A model with identical AUC and a calibration intercept of −0.983 would, at the same clinician-derived threshold of 2.44%, admit 951 additional patients per 3,129 presentations at a marginal cost of 53 admissions per additional event captured. Discrimination metrics cannot distinguish the two.
References
- Brier, G. W. (1950). Verification of forecasts expressed in terms of probability. Monthly Weather Review, 78(1), 1–3.
- Cox, D. R. (1958). Two further applications of a model for binary regression. Biometrika, 45(3/4), 562–565.
- Vickers, A. J., & Elkin, E. B. (2006). Decision curve analysis: a novel method for evaluating prediction models. Medical Decision Making, 26(6), 565–574.
- Steyerberg, E. W., Vickers, A. J., Cook, N. R., et al. (2010). Assessing the performance of prediction models: a framework for traditional and novel measures. Epidemiology, 21(1), 128–138.
- Van Calster, B., McLernon, D. J., van Smeden, M., et al. (2019). Calibration: the Achilles heel of predictive analytics. BMC Medicine, 17, 230.
- Collins, G. S., Reitsma, J. B., Altman, D. G., & Moons, K. G. M. (2015). Transparent reporting of a multivariable prediction model for individual prognosis or diagnosis (TRIPOD). BMJ, 350, g7594.
- Guo, C., Pleiss, G., Sun, Y., & Weinberger, K. Q. (2017). On calibration of modern neural networks. Proceedings of ICML 2017.
- Platt, J. (1999). Probabilistic outputs for support vector machines and comparisons to regularized likelihood methods. Advances in Large Margin Classifiers.
Reproducibility
The dataset (capstone-clinical-risk-scoring.xlsx) contains the presentation records with their data-quality faults and a negative-control variable intact, the analysis plan as agreed before modeling, and the generating coefficients. An executable notebook accompanies the chapter and reproduces every estimate, table and figure, including the construction of the shifted model and the net benefit calculation. Analyses use NumPy, pandas, scikit-learn, statsmodels and Matplotlib.