A Two-Level Fractional Factorial in Five Factors: Resolution, Blocking and Confirmation
Comparison of a resolution III quarter fraction with a resolution V half fraction on the same process, with the aliasing that reversed the recommendation.
Objective. To identify the process settings governing coating peel strength, and to quantify what a resolution III screening design failed to separate. Methods. A 25−1 half fraction with generator E = ABCD, replicated twice and blocked by primer batch, was run in randomized order within block, giving 31 usable runs after one gauge failure. All five main effects and all ten two-factor interactions were estimated by least squares with a block term. A 25−2 quarter fraction with generators D = AB and E = AC, run previously, was re-analyzed for comparison. Both recommendations were tested against baseline on independent panels. Results. The quarter fraction estimated the line-speed effect at +6.22 N (SE 0.86). In that design the B column is identical to the A×D column, so the estimate is the sum B + AD. The half fraction gives B = +0.17 N (SE 0.38, p = 0.65) and AD = +6.47 N (SE 0.38, p < 0.001). Blocking reduced the residual standard deviation from 1.557 to 1.033 N and every effect standard error by 34%. Confirmation of the screening recommendation gave −0.16 N (95% CI −0.96 to +0.63); confirmation of the half-fraction recommendation gave +9.46 N (95% CI +8.61 to +10.31). Conclusion. The screening design's recommendation was an aliased interaction reported under a main-effect label. The failure is a property of the design and is not detectable from its output.
1. Designs
| Design | Generators | Defining relation | Settings | Runs | Resolution |
|---|---|---|---|---|---|
| Quarter fraction | D = AB, E = AC | I = ABD = ACE = BCDE | 8 | 16 | III |
| Half fraction | E = ABCD | I = ABCDE | 16 | 32 | V |
A full 25 factorial requires 32 distinct settings and 64 runs under duplicate replication. Each run entails a line changeover, and the available budget was 32 runs, which fixes the half fraction as the largest admissible design.
Under I = ABD = ACE = BCDE the alias chains for the main effects are A = BD = CE, B = AD, C = AE, D = AB and E = AC. Every main effect is aliased with at least one two-factor interaction, which is the definition of resolution III. Under I = ABCDE the main effects are aliased only with four-factor interactions and the two-factor interactions only with three-factor interactions, so all fifteen are estimable on the assumption that interactions of order three and above are negligible.
2. Data preparation
Thirty-three records were delivered. One was an exact duplicate written by the data logger; one panel returned no reading following a gauge fault mid-run. Thirty-one runs remain, giving both replicates at 15 of the 16 design points and a single replicate at the sixteenth. The resulting slight imbalance is handled by least squares. Hand-computed orthogonal contrasts would not be valid on an unbalanced design, which is a practical argument for fitting a model rather than differencing column means once any run is lost.
3. Screening design results
| Factor | Estimate (N) | Estimand |
|---|---|---|
| A oven temperature | +10.31 | A + BD + CE |
| B line speed | +6.22 | B + AD |
| C primer viscosity | +1.57 | C + AE |
| D cure time | +1.28 | D + AB |
| E nozzle pressure | −0.98 | E + AC |
The estimate for B is 7.2 standard errors from zero. It is important to be clear that neither the point estimate nor its standard error is incorrect: the design estimates the quantity B + AD with the stated precision. The defect is that the quantity estimated is not the quantity of interest, and the output carries no indication of this.
4. Half fraction results
| Term | Effect (N) | SE | p |
|---|---|---|---|
| A oven temperature | +8.467 | 0.377 | <0.001 |
| A:D temperature × cure | +6.471 | 0.377 | <0.001 |
| C:E viscosity × pressure | +2.447 | 0.377 | <0.001 |
| C primer viscosity | +2.014 | 0.377 | <0.001 |
| D cure time | +2.007 | 0.377 | <0.001 |
| Block, batch 2 | +1.691 | 0.377 | 0.001 |
| E nozzle pressure | −1.044 | 0.377 | 0.015 |
| B line speed | +0.174 | 0.377 | 0.651 |
The line-speed effect is +0.174 N against a standard error of 0.377, and the temperature-by-cure-time interaction is +6.471. The correspondence between the latter and the +6.22 reported by the screening design is close, as the alias relation B = AD predicts.
Six of the fifteen estimated terms attain p < 0.05. Under a complete null one would expect approximately one, so the majority are not attributable to multiplicity. The appropriate discipline nonetheless remains to rank terms by magnitude relative to the standard error rather than by p-value, since borderline terms in a family of fifteen warrant the caution established in Capstone 4.
5. Blocking
| Model | Residual SD (N) | SE of an effect (N) |
|---|---|---|
| Batch as a block | 1.033 | 0.377 |
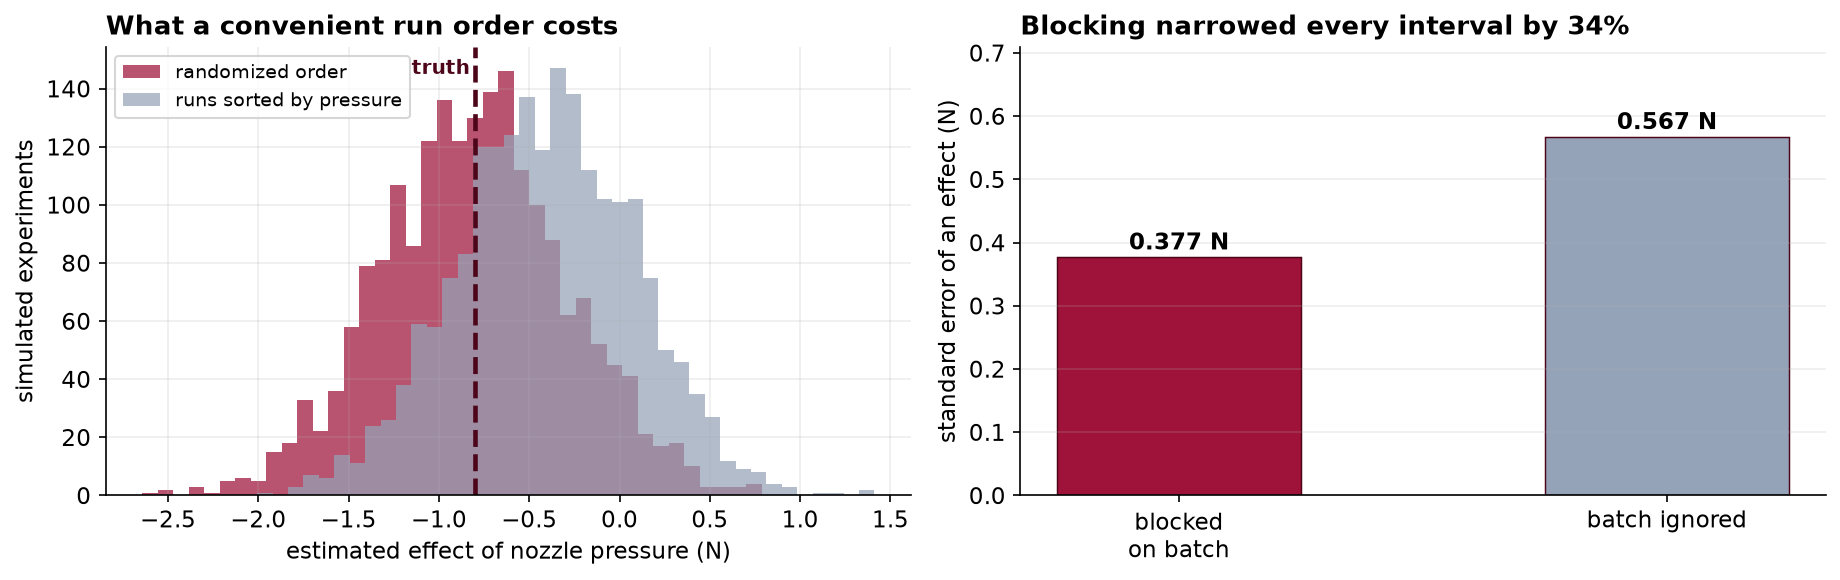
| Batch ignored | 1.557 | 0.567 |
Batch was a known and predictable source of variation and was therefore eliminated by design rather than by randomization. Assigning replicate 1 wholly to batch 1 and replicate 2 wholly to batch 2 confounds the block with the replicate, which is acceptable because the replicate contrast is of no scientific interest. Randomizing batches across runs would have transferred the same variation into the residual, widening every interval by approximately 50% for no compensating benefit.
6. Randomization
Run order within block was randomized. A simulation of 2,000 experiments quantified the alternative. Introducing a linear drift of 0.05 N per run and ordering the runs by nozzle pressure rather than at random moves the mean estimated pressure effect from −0.805 N to −0.408 N, against a true value of −0.80.
The induced bias is approximately constant in absolute terms and attaches to whichever factor determines the run order. It is therefore negligible relative to the temperature effect and comparable to the whole of the pressure effect. Since the magnitudes of the effects are unknown prior to the experiment, no run order can be selected that is safe on this criterion, which is the general argument for randomization.
7. Confirmation
| Confirmation | Baseline | Alternative | Difference (N) | 95% CI | p |
|---|---|---|---|---|---|
| Screening recommendation | 60.74 | 60.58 | −0.16 | [−0.96, +0.63] | 0.681 |
| Half-fraction recommendation | 60.54 | 70.00 | +9.46 | [+8.61, +10.31] | <0.001 |
The cell means underlying the second recommendation exhibit the interaction directly: at 170 °C the means are 60.89 N at a 45-second cure and 56.73 N at 75 seconds, while at 190 °C they are 63.19 N and 71.67 N. Extending the cure is detrimental at the low temperature and strongly beneficial at the high one, so the main effect of cure time, +2.01 N, averages across conditions in which the factor acts in opposite directions and should not be quoted alone.
8. Discussion
The central point is that aliasing is a property of the design matrix and not of the data, the estimator or the analyst. Within the eight settings of the quarter fraction, the column of signs for B and the column for A×D are elementwise identical, since D was constructed as AB and therefore AD = A(AB) = B. No estimator can separate quantities that enter the design through the same column, and no diagnostic computed from those data can indicate that separation has failed.
The practical consequence is that low-resolution designs do not fail conspicuously. They return estimates with correct standard errors and conventional significance, and the recommendation that follows is confidently wrong. The alias structure should therefore be reported alongside the estimates whenever a fractional design is used, and where it is not reported a reader should assume it is unfavorable.
Two limitations are worth recording. First, resolution V estimability rests on the assumption that three-factor and higher interactions are negligible. This is conventional and generally defensible for physical processes, and it remains an assumption. Second, each factor was studied at two levels only, so the model is linear in each factor by construction and curvature is undetectable. Center points would test for curvature at modest cost, and a response surface design would be required to locate an optimum rather than a direction of improvement.
9. Conclusion
A resolution III quarter fraction attributed +6.22 N to line speed. The estimand was B + AD. A resolution V half fraction on the same process gives B = +0.17 N (p = 0.65) and AD = +6.47 N (p < 0.001). Confirmation runs returned −0.16 N for the screening recommendation and +9.46 N for the recommendation derived from the half fraction. Blocking on primer batch reduced the standard error of every effect by 34%.
References
- Box, G. E. P., Hunter, J. S., & Hunter, W. G. (2005). Statistics for Experimenters: Design, Innovation, and Discovery (2nd ed.). Wiley.
- Finney, D. J. (1945). The fractional replication of factorial arrangements. Annals of Eugenics, 12(1), 291–301.
- Montgomery, D. C. (2019). Design and Analysis of Experiments (10th ed.). Wiley.
- Fisher, R. A. (1935). The Design of Experiments. Oliver & Boyd.
- Daniel, C. (1959). Use of half-normal plots in interpreting factorial two-level experiments. Technometrics, 1(4), 311–341.
- Box, G. E. P., & Wilson, K. B. (1951). On the experimental attainment of optimum conditions. Journal of the Royal Statistical Society, Series B, 13(1), 1–45.
- Wu, C. F. J., & Hamada, M. S. (2021). Experiments: Planning, Analysis, and Optimization (3rd ed.). Wiley.
Reproducibility
The dataset (capstone-designing-a-factorial-experiment.xlsx) contains both designed experiments with coded and decoded factor columns, both confirmation studies, the design plan as written before collection, and the generating model. An executable notebook accompanies the chapter and reproduces every estimate, table and figure, including the column-identity check that establishes the alias structure and the 2,000-replicate randomization simulation. Analyses use NumPy, pandas, SciPy, statsmodels and Matplotlib.