We Tested 600 Children and Learned What 86 Would Have Told Us
The assessment worked. The way the sample was spread across schools is what cost us, and it is fixable next time.
Recommendation
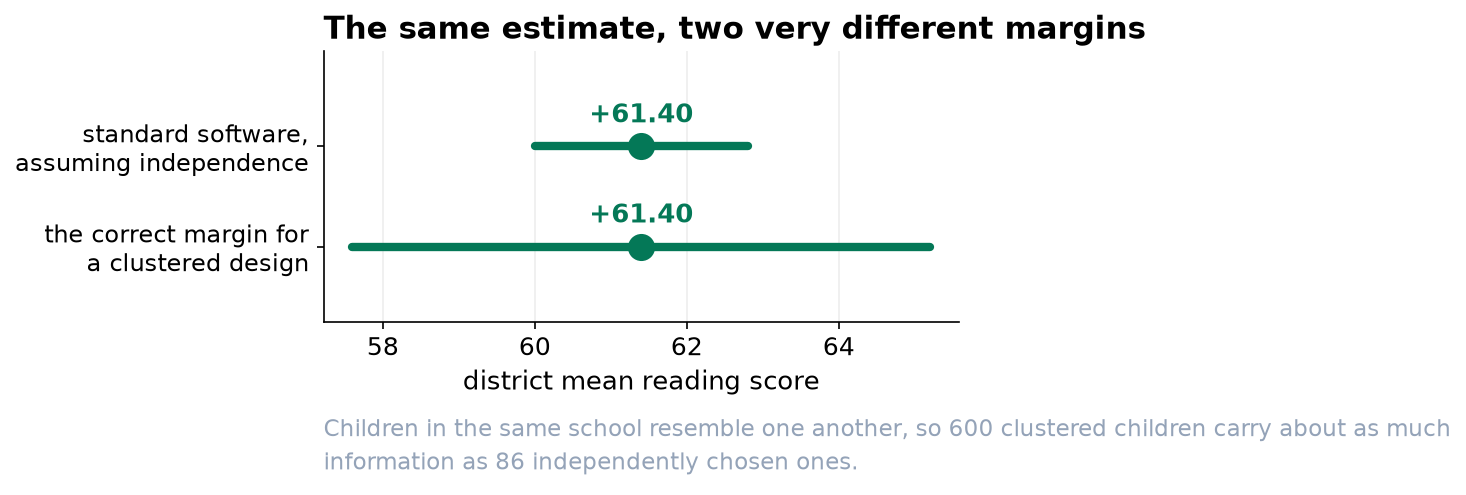
The district mean reading score is 61.4, give or take about 3.8 points. Please do not quote the tighter figure of plus or minus 1.4 that standard software produces, because it assumes each child was picked independently and they were not. Next time, test fewer children in more schools: the same budget would buy an estimate roughly twice as precise.
What we did and why
There is no central list of sixth-grade children, only a list of the district's 120 schools. So we drew 24 schools at random and tested 25 children in each, 597 assessments in total. That is the only practical design available, and it kept fieldwork inside budget by concentrating the testing in 24 buildings rather than sending assessors to all 120.
The catch, in one sentence
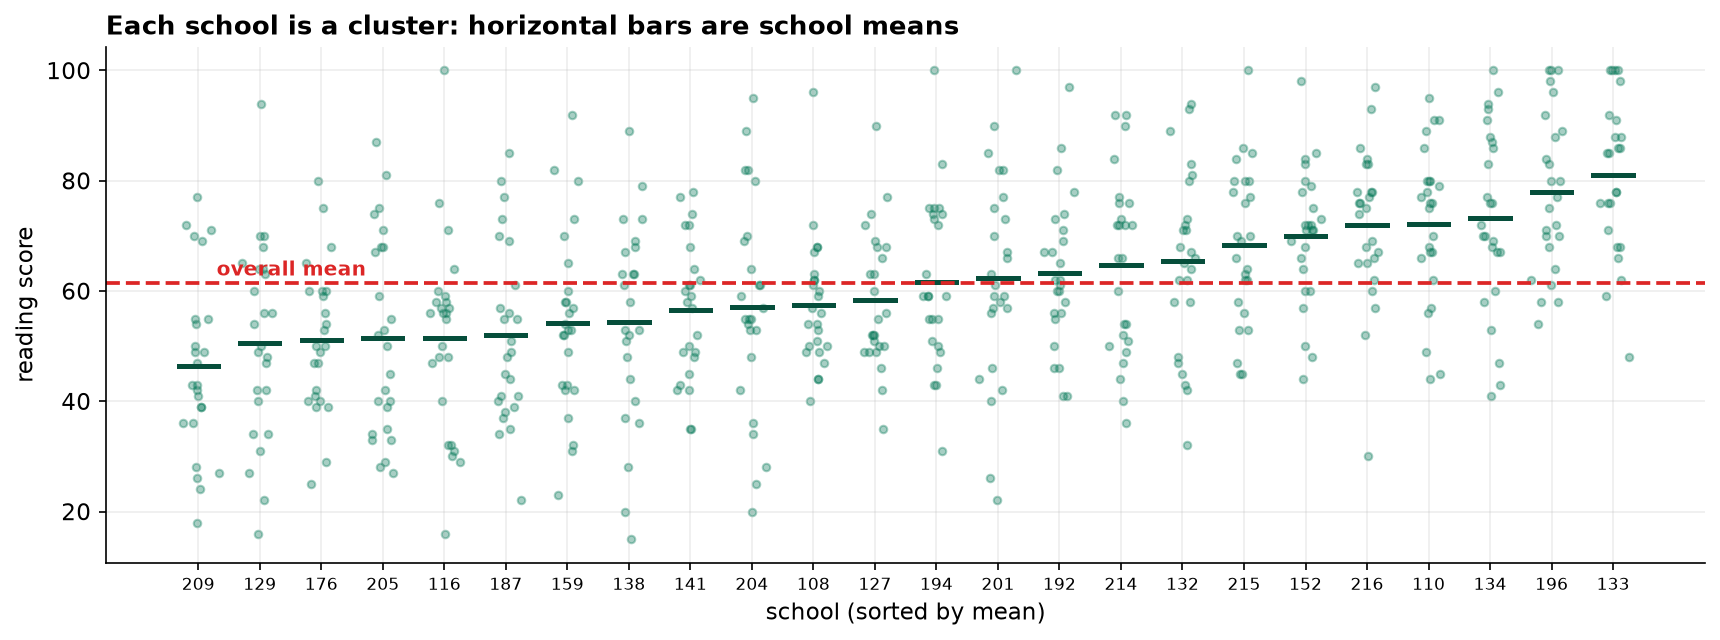
Children in the same school resemble each other, so the second child tested in a school tells you less than the first did, and the twenty-fifth tells you very little. School averages in our sample ranged from 46 to 81 points, which means knowing a child's school already tells you a lot about their likely score.
What that costs
Statistically, our 597 assessments carry about as much information as 86 children picked at random from across the district. Roughly 511 of the tests we scored added very little to the headline figure. That is not wasted effort in any moral sense, but it is a real budget question.
The practical consequence is the margin of error. Reported correctly it is about 3.8 points. Reported the naive way it looks like 1.4, which is a claim the study cannot support.
What to do differently
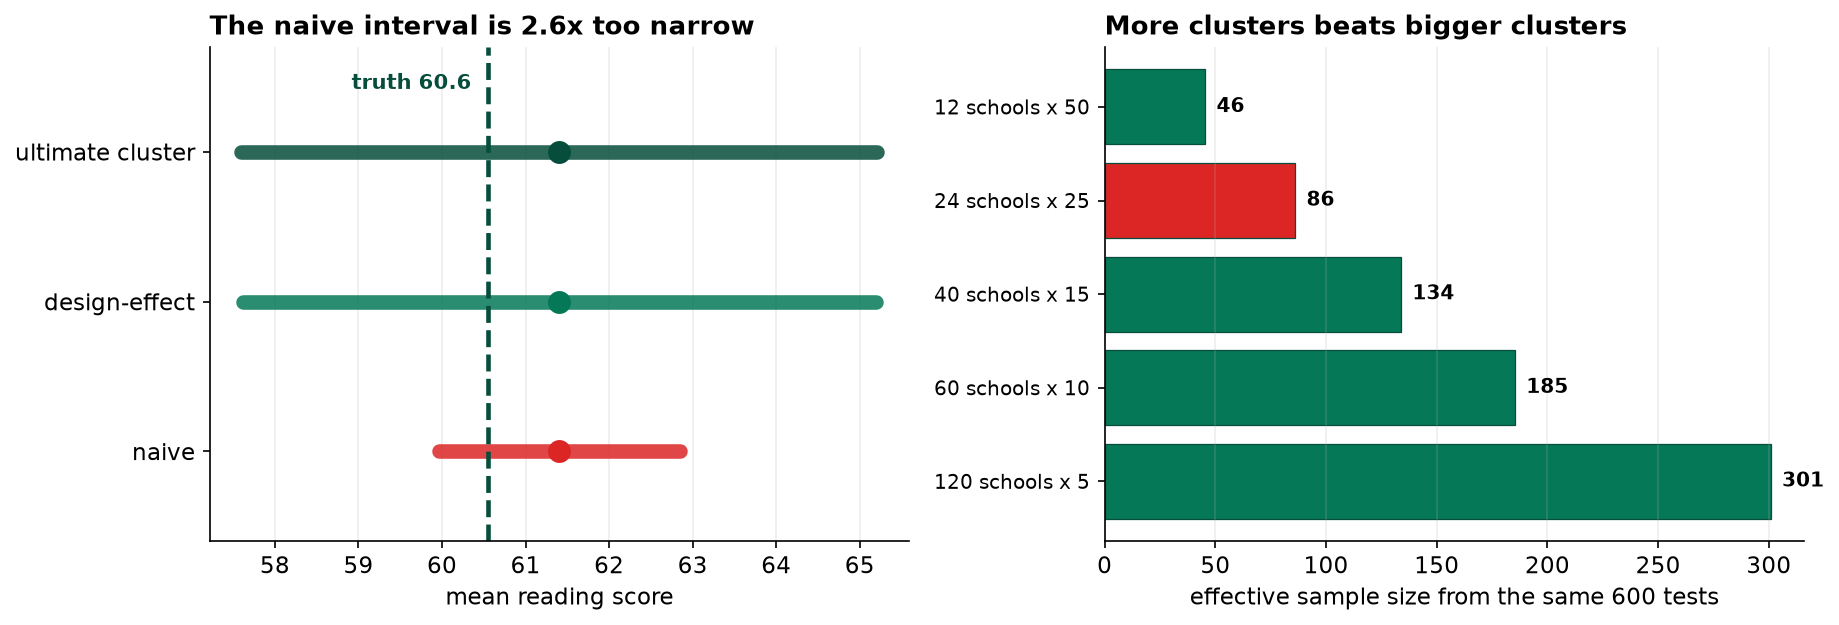
- More schools, fewer children in each. Sixty schools of ten children would have given us the equivalent of 185 independent assessments instead of 86, from the same 597 tests.
- Budget for travel, not for grading. The expensive thing statistically is visiting few schools; the cheap thing is grading papers. Our costs are currently arranged the other way around.
- Decide this before fieldwork, not after. The calculation takes minutes and it changes the design. Done afterwards it only tells you what you should have done.
What we cannot say
This is a district-level estimate. It is not a school-level one, and the school averages in the chart should not be read as a ranking: each rests on about 25 children and would move substantially if a different 25 had been drawn. Publishing them as a public ranking would attach consequences to what is mostly noise. Separately, a principal who declines to take part removes 25 children at once, so participation decisions matter far more here than in an ordinary survey.