Six in Ten Would Recommend Us, Not Six and a Half
The headline moves once the survey is weighted, and the reason it moves is worth two minutes of your time.
Recommendation
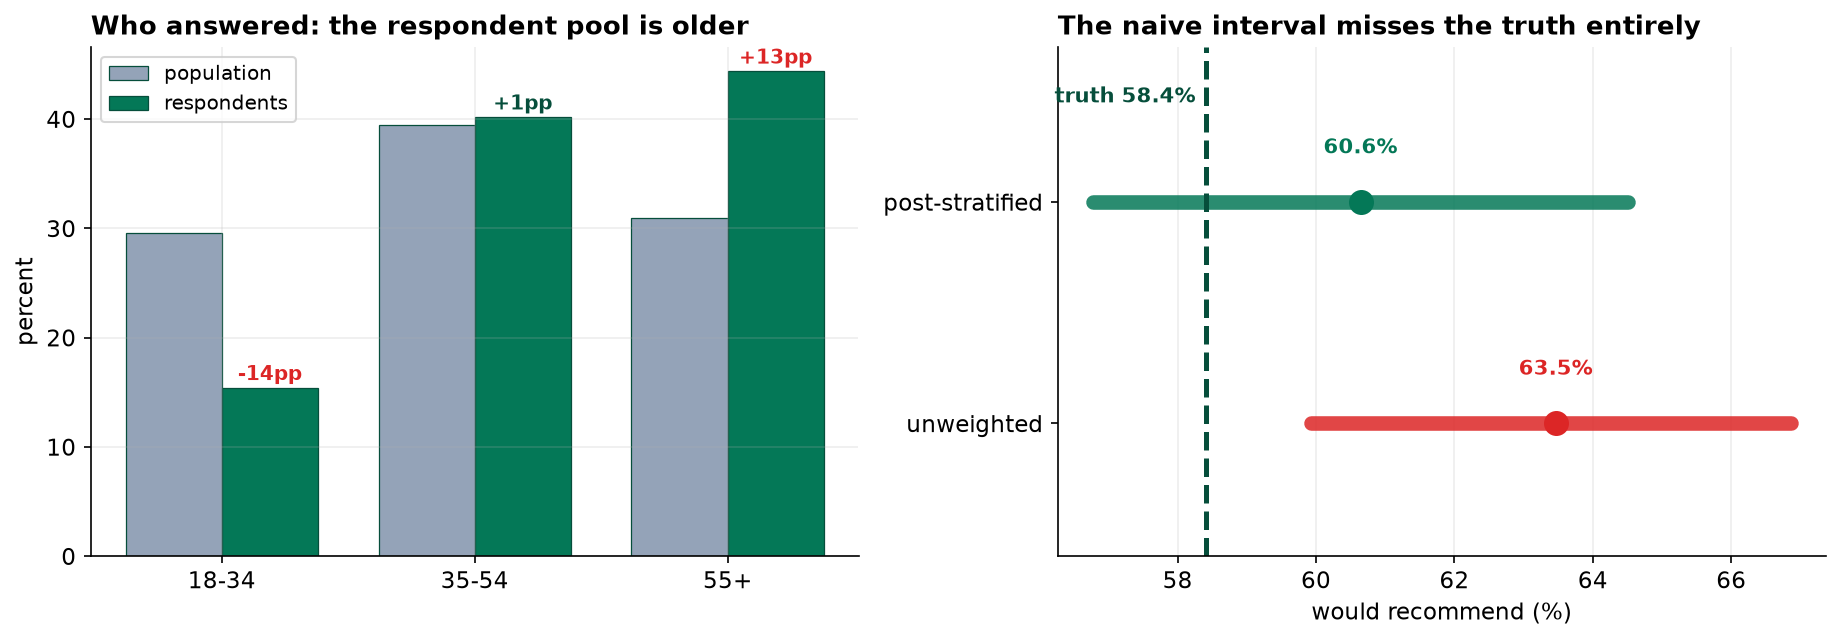
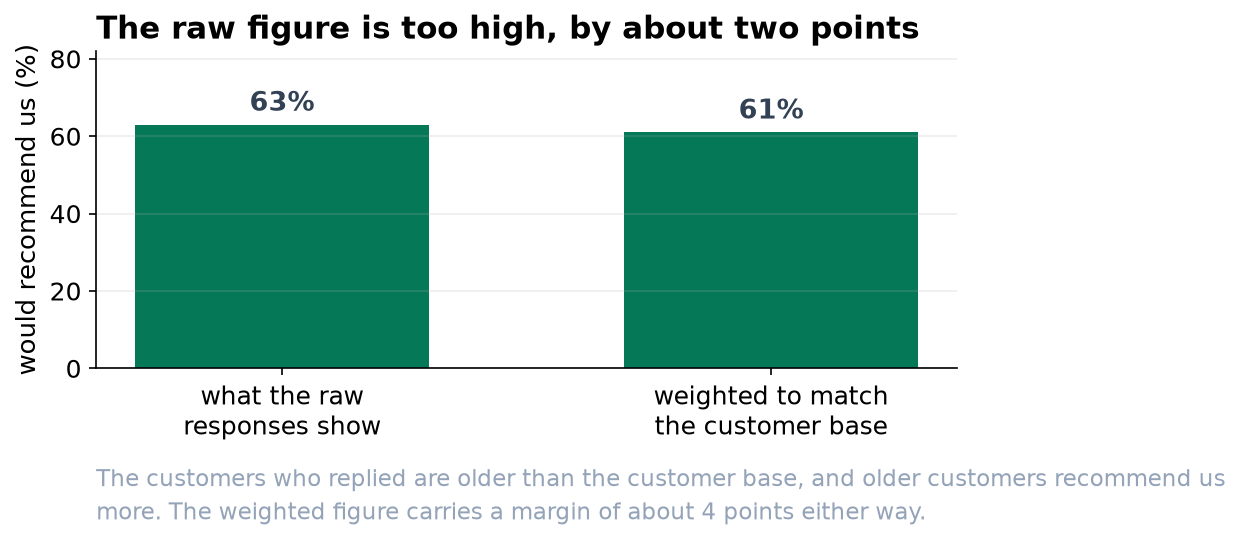
Report 61 percent would recommend us, give or take about 4 points, not the 63 percent the raw responses show. The raw figure is too high because the customers who replied are much older than our customer base, and older customers recommend us more. Please do not publish the unweighted number.
What we did
We invited 1,200 of our 60,000 customers, chosen at random within each region so that every region could be reported separately. 739 replied, a response rate of 62 percent. Region and age were taken from our own records rather than asked on the form, which meant we knew something about the people who did not reply. That turned out to be the most important decision in the whole study.
Why the raw number is wrong
Reply rates were not even. Customers aged 55 and over replied at 84 percent; customers under 35 replied at 34 percent. The result is that under-35s make up 30 percent of our customers and only 15 percent of the responses, while the over-55s make up 31 percent of customers and 44 percent of responses.
Since older customers are more likely to recommend us, a response pool skewed old produces a recommend rate skewed high. Weighting the responses back to the true customer profile brings the figure down by nearly three points.
What this costs us in precision
Weighting is not free. Counting some replies for more than others uses the sample less efficiently, so the margin of error widens from about 3.5 points to about 3.9. In effect our 739 replies do the work of roughly 612. That is the right trade: a slightly less precise number that is in the right place beats a precise one that is not.
Two things to fix before the next wave
- Chase the under-35s. A 34 percent reply rate in that group is what forced the correction. A reminder cycle aimed only at them would do more for accuracy than a larger sample would.
- Improve the contact records. 4,538 customers (7.6 percent) had no usable contact details, so they could never have been invited. They are disproportionately young and disproportionately Western, and no amount of clever analysis can bring them back. This is a data-quality job, not a survey job.
What we cannot say
Weighting corrects for the things we know about non-responders, which here means age and region. It cannot correct for the fact that satisfied customers are simply more willing to fill in a survey than dissatisfied ones, because we only learn satisfaction from people who replied. Our best judgment is that the true figure is a little below our weighted estimate rather than above it. Regional figures should be treated as indicative only: the West rests on 95 replies and its margin of error is over ten points either way.