Rank-Based Comparison of Customer Experience Ratings Across Four Retail Locations
Kruskal-Wallis with Dunn's post-hoc procedure under Holm correction, and the non-transitivity of pairwise significance.
Keywords: Kruskal-Wallis; Dunn's test; Holm correction; epsilon-squared; ordinal outcomes; stochastic dominance; non-transitivity of significance; unequal group sizes.
1. Introduction
Comparison of an ordinal outcome across several independent groups is a routine problem with two routine errors. The first is applying one-way ANOVA to a bounded rating scale on the grounds that the sample is large; this conflates robustness of the sampling distribution with meaningfulness of the estimand, since the arithmetic mean of an ordinal variable presupposes interval spacing the instrument does not supply. The second is reading the omnibus result as if it licensed statements about particular groups.
The present analysis addresses both. Kruskal-Wallis is used as the omnibus procedure, and Dunn's test under Holm correction provides the pairwise comparisons. The resulting pattern is instructive in its own right: pairwise significance does not induce a total order over the groups, a point of interpretation that is frequently mishandled in applied reporting.
The hypotheses are H₀: the four location rating distributions are identical, against H₁: at least one differs stochastically, evaluated at α = 0.05.
2. Data
| Step | Rule | Result |
|---|---|---|
| Raw export | — | 201 rows |
| De-duplication | drop duplicate records | 198 rows |
| Missing values | drop rows missing the rating | 195 rows |
| Range validation | retain ratings 1–10 | 194 rows |
| Label normalization | case-fold location labels | 4 groups |
| Location | n | Median | IQR | Mean | SD | Rated 8+ |
|---|---|---|---|---|---|---|
| Riverside | 46 | 8 | 7–9 | 7.96 | 1.33 | 63% |
| Old Town | 48 | 7 | 7–8 | 7.42 | 1.37 | 48% |
| Northgate | 57 | 7 | 6–8 | 6.79 | 1.74 | 33% |
| Harbour Point | 43 | 6 | 4–7 | 5.63 | 2.24 | 23% |
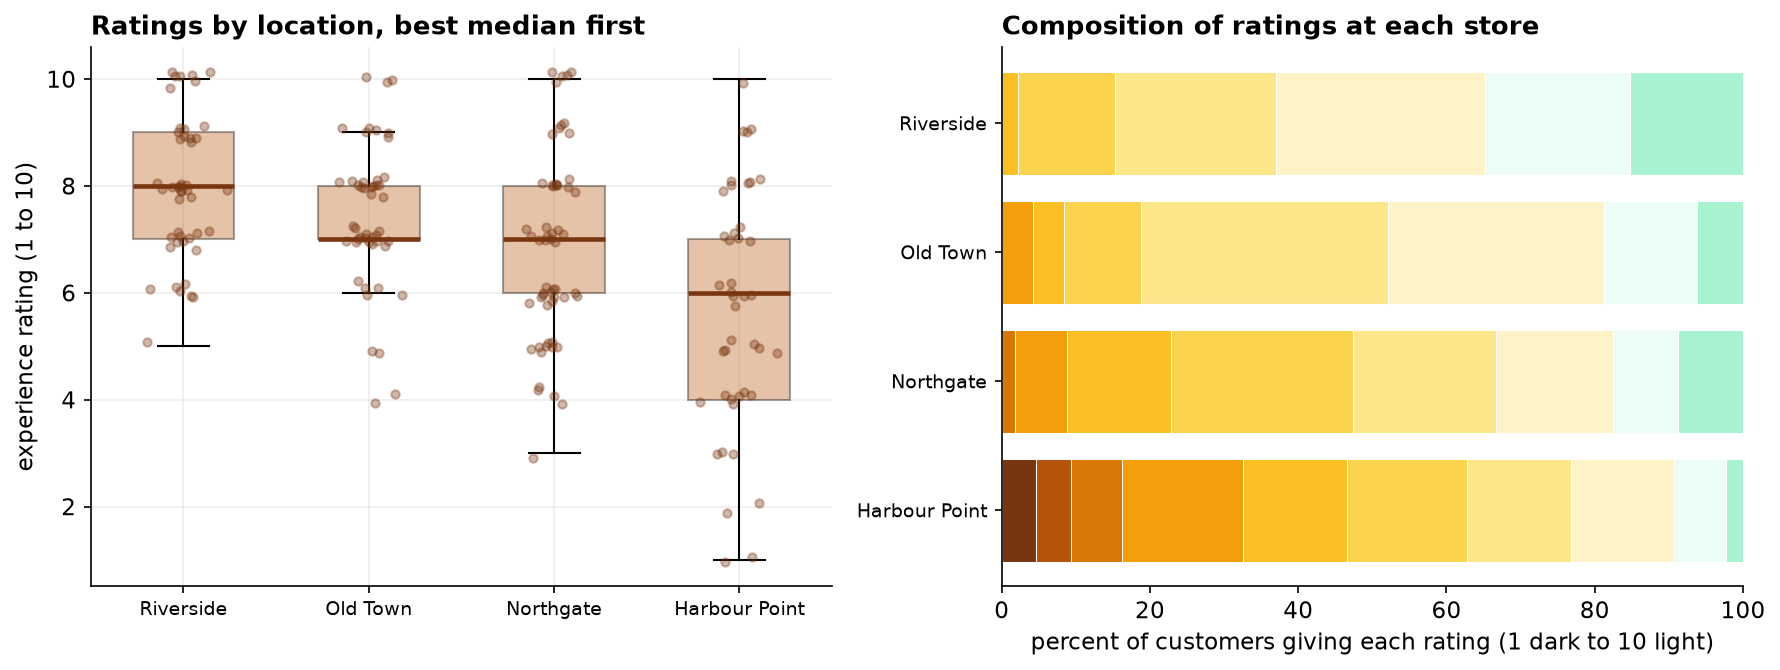
Two features of the descriptive picture matter for what follows. Harbour Point is not only lowest but substantially more dispersed, with a standard deviation 68% larger than the tightest group; dispersion is a substantive finding here, indicating variability of experience rather than a uniform deficit. Second, Old Town and Northgate share a median of 7 while differing markedly in their upper tails, a configuration that will demonstrate the limits of median-based reasoning in Section 5.
3. Methods
| Assumption | Test | Result | Verdict |
|---|---|---|---|
| Normality, Riverside | Shapiro-Wilk | W = 0.931, p = 0.0092 | violated |
| Normality, Old Town | Shapiro-Wilk | W = 0.932, p = 0.0084 | violated |
| Normality, Northgate | Shapiro-Wilk | W = 0.956, p = 0.0373 | violated |
| Normality, Harbour Point | Shapiro-Wilk | W = 0.971, p = 0.3302 | not rejected |
| Homogeneity of variance | Levene | p = 0.0012 | violated |
| Homogeneity of variance | Bartlett | p = 1.11e-03 | violated |
No individual group departs dramatically from normality, but with ratings concentrated in the upper half of a bounded scale the departures are systematic. Together with the violation of variance homogeneity and the ordinal measurement level, the parametric route is not adopted.
Kruskal-Wallis ranks all observations jointly and compares mean ranks across groups; it accommodates unequal group sizes without adjustment. Effect size is reported as ε² = (H − k + 1) / (N − k), the proportion of rank variance attributable to group membership. Dunn's test was specified in advance as the post-hoc procedure, using the pooled ranking from the omnibus test, with Holm's step-down correction across the six comparisons. Analyses used SciPy and scikit-posthocs in Python 3.
4. Results
| Statistic | Value |
|---|---|
| Kruskal-Wallis H | 32.751 |
| df | 3 |
| p-value | 3.64e-07 |
| Epsilon-squared | 0.157 |
| N | 194 |
Location accounts for approximately 16% of the variance in ranks, a moderate effect for a factor as coarse as premises. The omnibus result licenses only the statement that at least one location differs.
| Comparison | Mean-rank difference | Holm-adjusted p | Verdict |
|---|---|---|---|
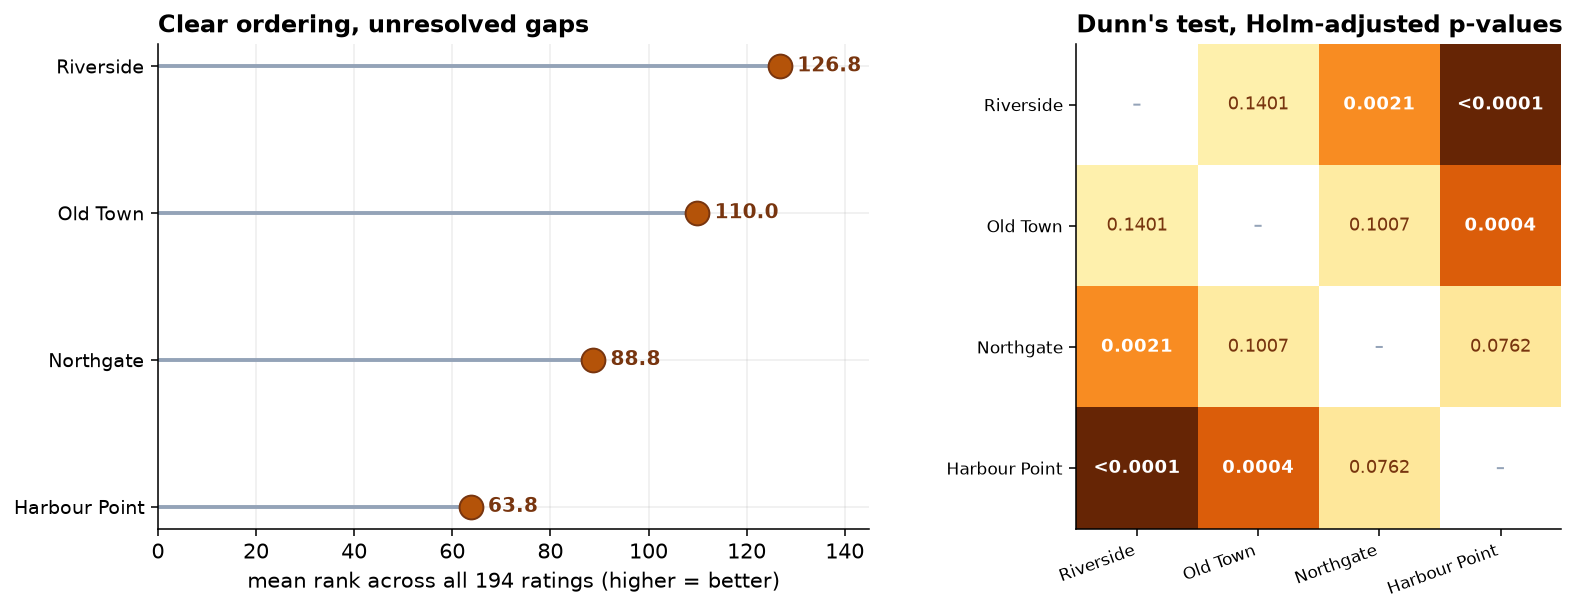
| Riverside vs Harbour Point | +63.0 | < 0.0001 | significant |
| Old Town vs Harbour Point | +46.2 | 0.0004 | significant |
| Riverside vs Northgate | +38.1 | 0.0021 | significant |
| Northgate vs Harbour Point | +25.0 | 0.0762 | not distinguishable |
| Old Town vs Northgate | +21.2 | 0.1007 | not distinguishable |
| Riverside vs Old Town | +16.8 | 0.1401 | not distinguishable |
Three of six comparisons survive correction, and they are the three largest gaps. The three that do not are precisely the adjacent-pair comparisons, whose mean-rank differences (25.0, 21.2 and 16.8) fall below the resolution the present sample provides. The Northgate-Harbour Point comparison (p = 0.0762) is marginal and would plausibly reach significance with a modest increase in sample size; it is reported as unresolved rather than as evidence of equivalence.
5. Two interpretive points
The procedure does not compare medians. Northgate and Old Town share a median of 7, yet Dunn's test separates them by 21.2 mean-rank points, driven by their upper tails (48% versus 33% rating 8 or above). Kruskal-Wallis, like the Wilcoxon-Mann-Whitney procedure of which it is the k-sample generalization, addresses stochastic ordering rather than any single location parameter. Reporting it as a test of medians is a category error that this dataset makes visible.
Pairwise significance is not transitive. Riverside differs from Northgate (p = 0.0021), while Old Town, whose mean rank lies between them, differs from neither (p = 0.1401 and p = 0.1007). This is not contradictory. Non-rejection is not an assertion of equality, and an intermediate group can overlap both neighbors at the available resolution while those neighbors are separated from each other. The practical implication is that the four locations should not be reported as ranked tiers. Presentational devices that impose a total order, including league tables and connecting-letters displays applied without care, overstate what the comparisons establish.
6. Interval estimates and confounding assessment
| Quantity | Estimate | 95% CI | Dunn p |
|---|---|---|---|
| Riverside vs Harbour Point | +2.0 | +1.0 to +3.0 | < 0.0001 |
| Old Town vs Harbour Point | +2.0 | +1.0 to +3.0 | 0.0004 |
| Riverside vs Northgate | +1.0 | +1.0 to +2.0 | 0.0021 |
| Northgate vs Harbour Point | +1.0 | +0.0 to +2.0 | 0.0762 |
| Old Town vs Northgate | +1.0 | +0.0 to +1.0 | 0.1007 |
| Riverside vs Old Town | +1.0 | +0.0 to +1.0 | 0.1401 |
| Top-box share, Riverside | 63% | 49% to 75% | — |
| Top-box share, Harbour Point | 23% | 13% to 38% | — |
| Epsilon-squared | 0.157 | 0.074 to 0.283 | — |
Three pairwise comparisons were reported as non-significant, and that designation conflates two distinct evidential situations: a small difference estimated precisely, and a potentially substantial difference estimated imprecisely. The interval estimates separate them. The Northgate and Harbour Point contrast admits a difference of up to two rating points, whereas the Riverside and Old Town contrast excludes anything beyond one. The former warrants further data collection; the latter does not.
The shift estimates are constrained to integer values because the outcome is integer-valued, which limits their resolution on a ten-point scale. The top-box proportions provide finer discrimination and are additionally expressed in units meaningful to operational readers, without requiring the arithmetic mean of an ordinal variable.
Customer tenure, recorded but not previously analyzed, satisfies neither condition required of a confounder: it does not differ across locations (p = 0.55) and is not associated with the rating (p = 0.85). That eliminates one alternative explanation. Catchment composition, store size, footfall and staffing were not measured and remain open, and the comparison is observational in a way the experimental capstone in this series is not.
7. Discussion
Customer experience differs materially across the four locations. Harbour Point is the lowest-rated and the most variable, and is distinguishable from both higher-rated stores; Riverside is the highest-rated. The middle two locations are not separable from each other.
Several limitations bear on interpretation. Feedback is volunteered, so respondents are self-selected, and if propensity to respond correlates with dissatisfaction differentially across stores, some portion of the observed gap is a participation artifact rather than a service difference. The locations differ in catchment, size, and traffic patterns, none of which is measured here, so the analysis localizes variation without explaining it; in particular it provides no basis for attributing the difference to staff. Group sizes reflect collection effort, so the pooled distribution does not describe the customer base.
The dispersion finding deserves separate treatment. A location whose ratings span the full scale is producing an inconsistent experience, which has different operational causes from a uniformly poor one and is invisible to any analysis reporting only central tendency. Investigation at Harbour Point should begin with variation across shifts, days, and staff configurations rather than with the site as a whole.
Finally, and as elsewhere in this series, the arithmetic mean of an ordinal rating should not be used for reporting. The response composition, or a top-box proportion, conveys the same information without presupposing equal spacing.
8. Conclusion
Customer experience ratings differ across the four locations (Kruskal-Wallis H = 32.751, df = 3, p = 3.64e-07, ε² = 0.157, N = 194). Three of six pairwise comparisons survive Holm correction: Riverside and Old Town each exceed Harbour Point, and Riverside exceeds Northgate. The adjacent-pair comparisons remain unresolved, and the locations should not be reported as an ordered ranking. Harbour Point is the indicated priority, on both level and variability of ratings.
References
- Kruskal, W. H., & Wallis, W. A. (1952). Use of ranks in one-criterion variance analysis. Journal of the American Statistical Association, 47(260), 583–621.
- Dunn, O. J. (1964). Multiple comparisons using rank sums. Technometrics, 6(3), 241–252.
- Holm, S. (1979). A simple sequentially rejective multiple test procedure. Scandinavian Journal of Statistics, 6(2), 65–70.
- Tomczak, M., & Tomczak, E. (2014). The need to report effect size estimates revisited: an overview of some recommended measures of effect size. Trends in Sport Sciences, 1(21), 19–25.
- Divine, G. W., Norton, H. J., Barón, A. E., & Juarez-Colunga, E. (2018). The Wilcoxon-Mann-Whitney procedure fails as a test of medians. The American Statistician, 72(3), 278–286.
- Gardner, M. J., & Altman, D. G. (1986). Confidence intervals rather than P values: estimation rather than hypothesis testing. British Medical Journal, 292(6522), 746–750.
- Hollander, M., Wolfe, D. A., & Chicken, E. (2014). Nonparametric Statistical Methods (3rd ed.). Wiley.
Reproducibility
The dataset (capstone-store-ratings-across-locations.xlsx) and an executable notebook reproducing every statistic, table, and figure accompany the chapter. Analyses use NumPy, pandas, SciPy, scikit-posthocs, and Matplotlib.