Rank-Based Association Between Ordinal Satisfaction and Repurchase-Intent Scales
Spearman's rho and Kendall's tau, with a sensitivity demonstration on scale coding.
Keywords: Spearman's rho; Kendall's tau-b; ordinal measurement; Likert scales; monotonic association; common-method bias; tied ranks.
1. Introduction
Likert-type response scales occupy an ambiguous position in applied measurement. Their response options are ordered, so the assignment of successive integers preserves meaningful information about direction. They do not, however, establish interval equivalence: no property of the instrument warrants the claim that the psychological distance between adjacent categories is constant across the range of the scale. Stevens' typology places such variables at the ordinal level, for which measures of monotonic rather than linear association are appropriate.
The practical consequence is that a product-moment coefficient computed on Likert scores is a function of the arbitrary numeric labels assigned to the categories, not of the responses alone. This report estimates the satisfaction-loyalty association using rank-based statistics and demonstrates the magnitude of the coding dependence directly. The hypotheses are H₀: ρs = 0 against H₁: ρs ≠ 0, evaluated two-sided at α = 0.05.
2. Instrument and data
Two 7-point fully labeled Likert items were administered, measuring overall satisfaction and self-assessed likelihood of repurchase, together with a continuous tenure item. The full instrument is reproduced on the Questionnaire sheet of the accompanying workbook. Respondents were self-selected from an email invitation to the active customer base.
| Step | Rule | Result |
|---|---|---|
| Raw export | — | 187 rows |
| De-duplication | drop duplicate submissions | 185 rows |
| Missing values | drop rows missing either scale | 183 rows |
| Range validation | retain responses coded 1–7 on both items | 182 rows |
| Satisfaction level | 1 | 2 | 3 | 4 | 5 | 6 | 7 |
|---|---|---|---|---|---|---|---|
| Respondents | 13 | 27 | 29 | 42 | 32 | 21 | 18 |
3. Methods
Spearman's ρ was computed as the Pearson correlation of midranks, the standard tie-handling convention, and serves as the primary statistic. Kendall's τb was computed as a corroborating measure; it is based on the excess of concordant over discordant pairs and incorporates an explicit correction for ties in either margin, which some authors regard as preferable on short scales. The two statistics are not on a common metric and are not expected to coincide numerically; τ is systematically smaller than ρ for a given strength of monotonic association.
To make the measurement argument empirically rather than rhetorically, each coefficient was recomputed under three strictly order-preserving re-codings of the seven categories. Such re-codings alter no respondent's answer and no respondent's rank; they alter only the numeric labels. A statistic appropriate to ordinal data must be invariant under this operation. Analyses used SciPy in Python 3.
4. Results
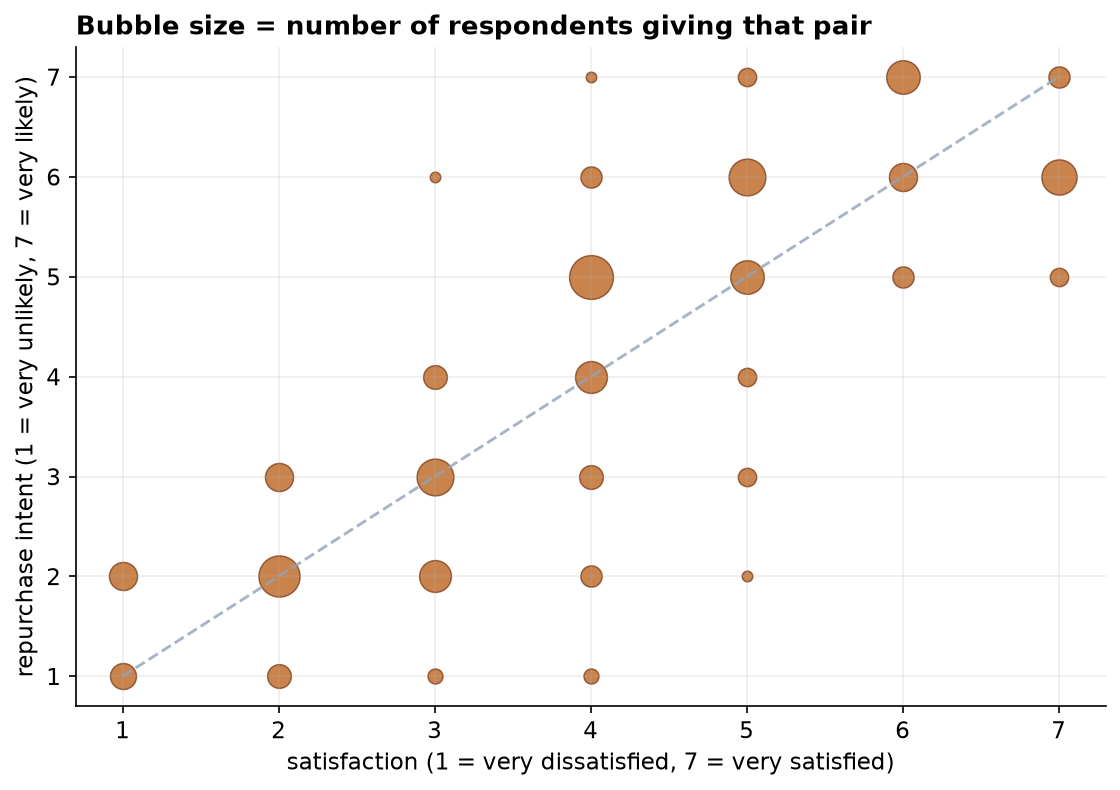
| Statistic | Value | p-value | Role |
|---|---|---|---|
| Spearman ρ | 0.829 | 2.84e-47 | primary |
| Kendall τb | 0.710 | 3.31e-35 | corroborating |
| Pearson r | 0.820 | 2.02e-45 | comparison only |
| n | 182 | — | complete, in-range cases |
All three statistics indicate a strong positive association. Under conventional coding, Pearson's r = 0.820 is close to ρ = 0.829, an agreement that might be taken to imply the choice of statistic is immaterial. The sensitivity analysis shows otherwise.
| Order-preserving coding | Category values | Pearson r | Spearman ρ |
|---|---|---|---|
| Equal spacing | 1, 2, 3, 4, 5, 6, 7 | 0.820 | 0.829 |
| Stretched at the top | 1, 2, 3, 4, 6, 9, 13 | 0.741 | 0.829 |
| Stretched at the base | 1, 5, 8, 10, 11, 12, 13 | 0.788 | 0.829 |
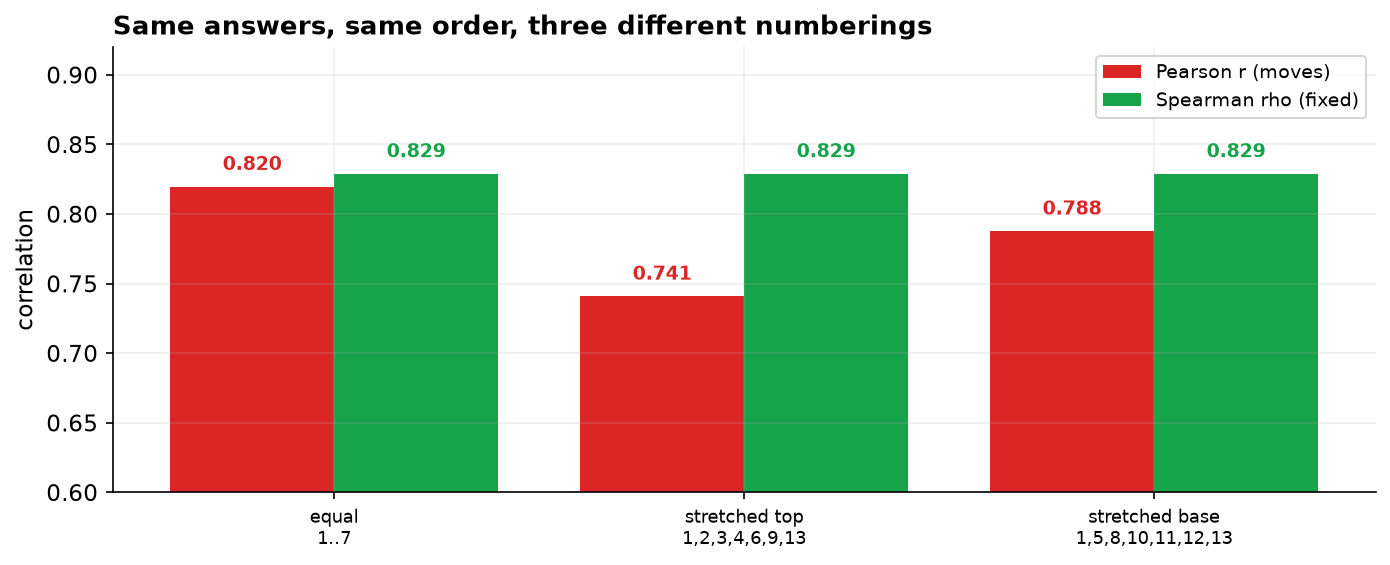
Pearson's coefficient ranges from 0.741 to 0.820 across the three codings, a span of 0.079, while ρ is fixed at 0.829. Since the codings are informationally equivalent with respect to the responses, the variation in r is attributable entirely to an analyst decision for which the instrument supplies no evidence. This is the substantive case for the rank statistic: not superior power or a different conclusion, but the absence of dependence on an unwarranted assumption.
5. Interval estimates and covariate adjustment
| Quantity | Estimate | 95% CI | Method |
|---|---|---|---|
| Spearman ρ | 0.829 | 0.779 to 0.867 | percentile bootstrap |
| Kendall τb | 0.710 | 0.659 to 0.758 | percentile bootstrap |
| Tenure vs satisfaction | ρ = +0.137 | p = 0.066 | Spearman |
| Tenure vs repurchase intent | ρ = +0.091 | p = 0.224 | Spearman |
| Satisfaction vs loyalty, tenure held constant | 0.828 | — | partial rank correlation |
Rank coefficients possess no convenient closed-form standard error, which is the usual reason they are reported without interval estimates. Resampling supplies one without distributional assumption: 10,000 resamples of the respondent set place the coefficient between 0.78 and 0.87. The point estimate is therefore reportable to two significant figures and no further.
Customer tenure was recorded but not analyzed in the original report. It is weakly related to both scales and its removal by partial rank correlation leaves the association essentially unchanged, at 0.828 against 0.829. Duration of the customer relationship is accordingly excluded as an explanation of the observed covariation.
The distinction between measured and unmeasured covariates is the operative one. Tenure could be adjusted for because it was collected. Transient respondent affect, which is the mechanism underlying common-method variance and the principal threat to this analysis, was not collected and is therefore not amenable to adjustment by any analytic technique. The remedy is a design in which the outcome is observed rather than reported.
6. Discussion
Satisfaction and stated repurchase intent are strongly monotonically associated (ρ = 0.829). Three limitations qualify the interpretation.
First, and most seriously, both variables were elicited from the same respondent, in the same instrument, within moments of each other. Common-method variance arising from transient affect, acquiescence, or consistency motivation inflates observed associations under precisely these conditions, and no design feature here permits its magnitude to be estimated. The reported coefficient should therefore be treated as an upper bound on the substantive association.
Second, the outcome is a stated intention rather than an observed behavior. The intention-behavior gap is well documented across consumer and health domains, and the correlation between intent and subsequent purchase is typically far below unity. The analysis establishes that two survey responses cohere; it does not establish that satisfaction predicts revenue. Linking respondents to transaction records would convert a within-instrument correlation into a predictive one.
Third, the sample is self-selected. Respondents to a voluntary satisfaction survey are plausibly enriched for strong opinion in either direction, so the moderate categories are likely under-represented relative to the customer base.
A methodological note extends beyond this analysis. The reasoning that motivates the rank statistic applies equally to the routine practice of reporting mean Likert scores. An arithmetic mean presupposes interval spacing, and a reported mean satisfaction is therefore subject to the same coding dependence demonstrated in Table 4. Medians, top-box proportions, and full response distributions carry no such presupposition.
7. Conclusion
Customer satisfaction and stated repurchase intent are strongly and positively associated on rank-based measures (ρ = 0.829, p < 0.001; τb = 0.710, n = 182). The rank statistic is invariant to order-preserving re-coding of the response categories, whereas the product-moment coefficient varies over 0.741 to 0.820 under the same operation, establishing the appropriateness of the former for ordinal data. Common-method variance and reliance on stated rather than observed behavior preclude a predictive claim.
References
- Spearman, C. (1904). The proof and measurement of association between two things. American Journal of Psychology, 15(1), 72–101.
- Kendall, M. G. (1938). A new measure of rank correlation. Biometrika, 30(1–2), 81–93.
- Stevens, S. S. (1946). On the theory of scales of measurement. Science, 103(2684), 677–680.
- Likert, R. (1932). A technique for the measurement of attitudes. Archives of Psychology, 140, 1–55.
- Jamieson, S. (2004). Likert scales: how to (ab)use them. Medical Education, 38(12), 1217–1218.
- Podsakoff, P. M., MacKenzie, S. B., Lee, J.-Y., & Podsakoff, N. P. (2003). Common method biases in behavioral research. Journal of Applied Psychology, 88(5), 879–903.
- Sheeran, P. (2002). Intention–behavior relations: a conceptual and empirical review. European Review of Social Psychology, 12(1), 1–36.
Reproducibility
The dataset (capstone-satisfaction-and-loyalty.xlsx), including the full instrument, and an executable notebook reproducing every statistic, table, and figure accompany the chapter. Analyses use NumPy, pandas, SciPy, and Matplotlib.