This is the first capstone, so it also sets the pattern the rest will follow: one real, slightly messy dataset taken all the way through the twelve-step framework, with every decision explained as we go. The question itself is about as simple as statistics gets, is a mean equal to a target value?, and that is the point. An easy test lets us focus on the habits the harder capstones depend on: describe before you test, clean honestly, check the assumption, and report the effect, not just the p-value.
- Setting
- Bay Roasters fills whole-bean bags labeled 340 g. Quality control pulled and weighed a sample of bags across one production day.
- The question
- Is the filling line on target, or is it running light or heavy?
- Why it matters
- Overfilling gives away product and margin on every bag. Underfilling shorts the customer and breaks net-content law. The manager has to know which way the line errs before deciding whether to recalibrate.
- What we do
- Take one slightly messy dataset all the way through the twelve-step framework: clean it honestly, check the normality assumption, run a one-sample t-test against the 340 g target, and report the interval and the cost per bag rather than only the p-value.
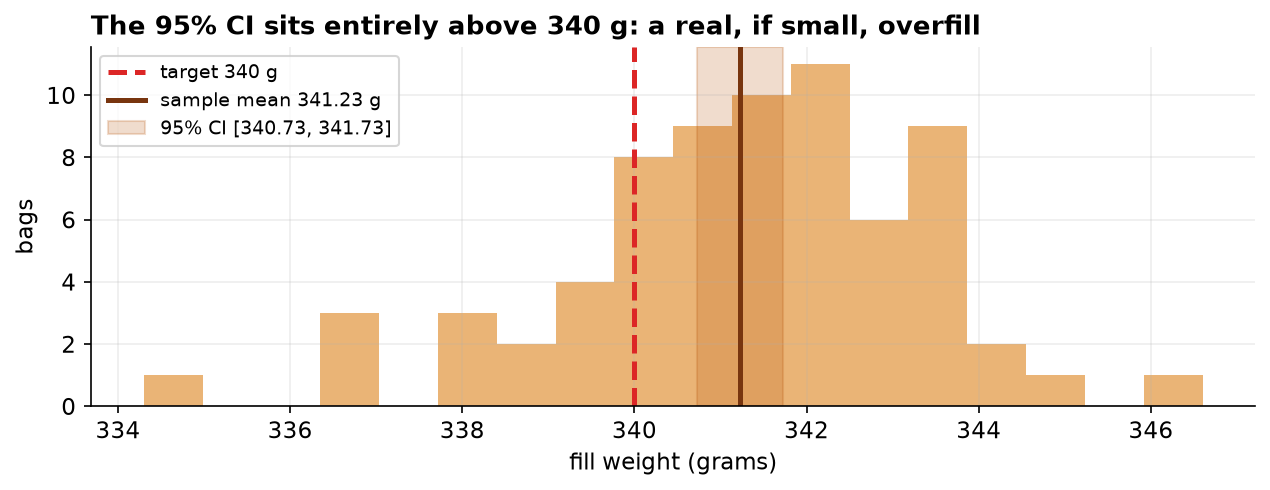
After cleaning, 70 bags average 341.23 g against a 340 g label. The gap is small but unmistakable: t(69) = 4.88, p < 0.001, with a 95% interval of [340.73, 341.73] g that sits entirely above the target. The line runs slightly heavy, giving away about a gram of coffee per bag, though no customer is ever shorted.
The Question, the Hypotheses, the Design
Bay Roasters fills whole-bean bags labeled 340 g (12 oz). Overfilling gives away product and margin; underfilling shorts the customer and breaks net-content law. Quality control pulled a sample of bags across one production day and weighed each. The manager's question is plain: is the line on target, or is it running light or heavy?
| Framework step | This project |
|---|---|
| Goal | Decide whether the mean fill weight equals the 340 g target. |
| Hypotheses | H₀: mean = 340 g vs H₁: mean ≠ 340 g, two-sided, α = 0.05. |
| Data type | One continuous outcome, fill_g (grams). The rest are labels. |
| Design | One sample of independent measurements vs a single fixed value. No groups, no pairing. |
A continuous outcome measured against one target, with no groups, is exactly what the one-sample t-test is for, so long as its normality assumption survives the check in Section 3.
Meet the Data, Then Clean It
The raw export has 78 rows but only 76 unique bag IDs, and its summary is nonsense: a minimum of 0 g and a maximum of 3410 g. Those are not light and heavy bags, they are recording errors, and a histogram makes that obvious at a glance. The real distribution is hiding inside a sensible range while three stray values stretch the axis.
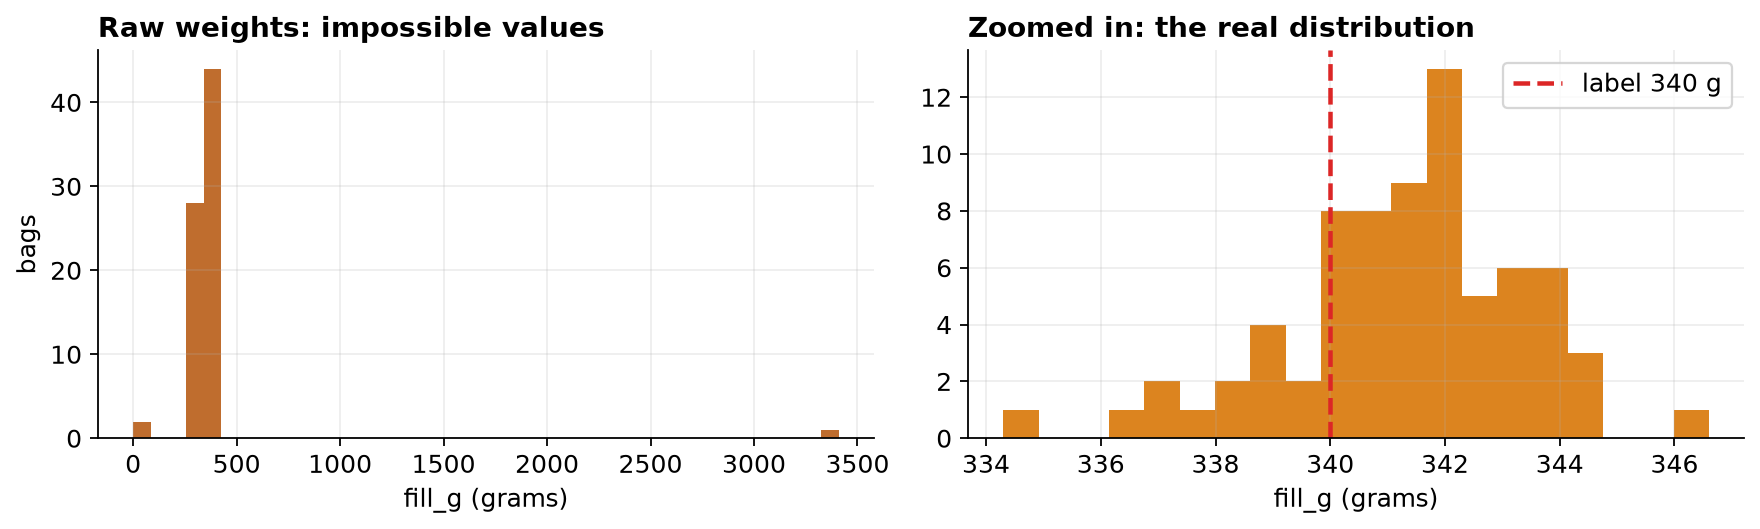
Cleaning is three deletions, in order, and we keep a written trail so the count is defensible: drop duplicate log rows, drop blank weights, and drop impossible values outside a 300 to 380 g range. Seventy-eight rows become seventy clean measurements.
The clean sample of n = 70 has a mean of 341.23 g and a standard deviation of 2.11 g, already about 1.2 g above the label. Whether that gap is real, or just the luck of which bags were sampled, is what the test decides, once we have checked that the test actually applies.
Check the Assumption Before the Test
The one-sample t-test trusts that the data are roughly normal. We check three ways, and we let the picture carry as much weight as the p-values.
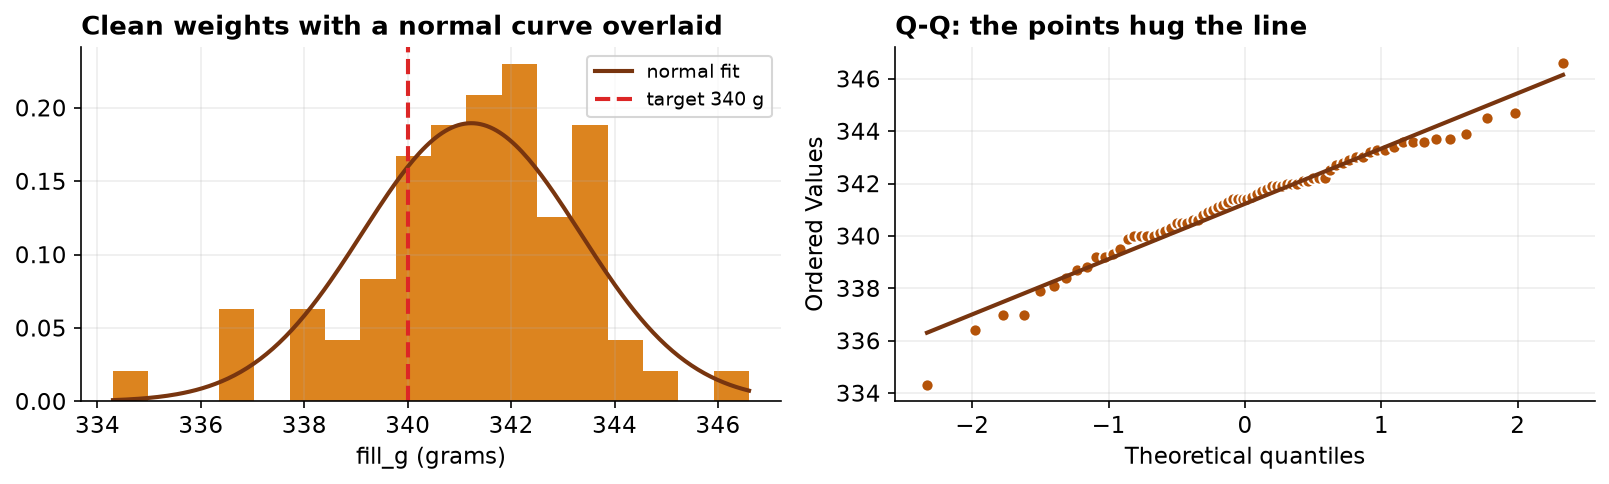
| Check | Result | Verdict |
|---|---|---|
| Shapiro-Wilk | W = 0.973, p = 0.14 | fails to reject normality |
| Kolmogorov-Smirnov | D = 0.080, p = 0.74 | fails to reject normality |
| Q-Q plot | points close to the line | normal is reasonable |
Both tests keep the normality assumption, and with n = 70 the Central Limit Theorem is a second safety net for the mean even if the tails were a little heavy. No transformation is needed. We proceed with the parametric one-sample t-test, and to be safe we will also run its rank-based twin, the Wilcoxon signed-rank test, which assumes nothing about normality. If they disagreed we would trust the rank-based one; here they will not.
Run the Test, Report the Whole Result
The test compares the sample mean to 340 g, scaled by how much sample means naturally wobble (the standard error). A t of 4.88 says the observed gap is almost five standard errors from the target, far more than sampling noise could plausibly produce.
The confidence interval is the most useful line for a non-statistician: we are 95% confident the true mean sits between 340.73 and 341.73 g. Because that whole range is above 340, we can say with confidence the line runs heavy, and by roughly one gram, not five and not a tenth. The Wilcoxon signed-rank test agrees (p ≈ 0.0000075), so the conclusion does not depend on the normality assumption at all.
The Verdict, the Cost, and the Ethics
Statistically, the mean is above target. The p-value cannot answer the next question, though: does the gap matter? The overfill is about 1.23 g per bag, roughly a third of one percent. Per bag that is nothing; across a million-bag run it is about 1,229 kg of coffee given away, real money for a commodity product. So the result is statistically significant, and at this scale it is worth acting on too. Significance and real-world importance are not the same thing, which is why we look at both.
A tiny p-value (chance is ruled out), a medium effect size (d ≈ 0.58, the overfill is real but modest per bag), and a confidence interval that says how precisely we know it (about one gram over, give or take a third of a gram). Reporting only the p would have hidden how small the per-bag effect is; reporting only the mean would have hidden how sure we are.
And the framework's last step, a skeptical look before acting:
- Sampling. The bags came from one day on two lines. If QC tends to weigh bags right after a calibration, the true overfill could be understated. A claim about "the process" needs samples spread across machine states, not one convenient window.
- Measurement. Everything rides on the scale. A scale reading half a gram high would invent an overfill that is not there, so calibration against a certified weight is part of trusting this number.
- Generalization. This supports a claim about this run, not a permanent property of the brand, until more days confirm it.
- The safe action. Nudge the fill target down toward roughly 340.5 g: it recovers most of the wasted coffee while staying comfortably above the label. Cutting straight to 340 g would push about half of future bags below the printed weight, which is exactly what net-content law forbids.
The One-Sample t-Test in Data Science & AI
This "compare a mean to a target" test shows up all over modern data work, usually under a different name.
| Where it appears | The target value |
|---|---|
| Model monitoring | Is this week's mean prediction error still at its baseline, or has the model drifted? |
| SLA / latency checks | Is mean response time at or below the 200 ms service-level target? |
| Guardrail metrics | During a rollout, has a key average (session length, error rate) moved off its historical level? |
| Calibration | Does a sensor or an annotation pipeline read, on average, to its reference standard? |
In production these tests run on huge samples, where the risk reverses: with millions of observations, a drift too small to matter turns "significant" instantly. That is why serious monitoring pairs the test with an effect size and a tolerance band (a minimum meaningful drift), and alerts only when both fire, exactly the discipline this capstone practiced on seventy bags of coffee.
Estimate, Do Not Just Test
The p-value answered a yes-or-no question and the answer was no, the bags are not filled to 340 g. It said nothing about by how much, and that is the only number the plant can act on.
| Quantity | Estimate | 95% confidence interval |
|---|---|---|
| Overfill per bag | +1.23 g | +0.73 to +1.73 g |
| Giveaway per million bags | 1,229 kg | 727 to 1,730 kg |
| Cohen's d | 0.58 | 0.32 to 0.94 (bootstrap) |
| Margin of error on the mean | ± 0.50 g at 95% confidence | |
The giveaway is not 1,229 kg per million bags. It is somewhere between roughly 700 and 1,700 kg, and a planner budgeting against the point estimate is working to a precision 70 bags cannot supply. Note that the effect size gets an interval too: Cohen's d runs from 0.32 to 0.94, which spans "small" to "large" in the conventional labels. Anyone writing "a medium-sized effect" is describing the midpoint of a range, not a fact the data settled.
The full project, step by step
The companion notebook runs all twelve framework steps end to end: it loads the raw file, describes and plots
it, cleans the duplicates, blanks, and impossible values with a printed audit trail, checks normality
(Shapiro-Wilk, Kolmogorov-Smirnov, Q-Q), runs the one-sample t-test with scipy and confirms the
effect size, interval, and power with pingouin, and cross-checks it with the Wilcoxon signed-rank
test. Every number in this chapter comes from its output.
The dataset (capstone-coffee-fill-weight.xlsx) holds the raw
QC log on the fills sheet, with a codebook and notes, deliberately including the blanks, duplicates, and
impossible values so you can practice the cleaning yourself. Two written reports accompany it: a
plain-language brief, the one-page memo a statistician wrote for the plant manager (recommendation
first, statistics in plain words), and a technical report, a journal-style write-up for a
statistical reader with full methods, results tables, diagnostics, and references.
🎓 Key Takeaways
- ✓The one-sample t-test compares a continuous mean to a fixed target; here 70 bags averaged 341.23 g against a 340 g label.
- ✓Clean first, and show your work: 78 raw rows became 70 after dropping 2 duplicates, 3 blanks, and 3 impossible values.
- ✓Earn the test: Shapiro-Wilk (p = 0.14) and the Q-Q plot kept normality, so the parametric test was valid; Wilcoxon confirmed it.
- ✓Report three things: t(69) = 4.88, p < 0.001, 95% CI [340.73, 341.73], and Cohen's d = 0.58, significant and, at scale, meaningful.
- ✓End with judgment: the fix is to trim the target toward 340.5 g, saving coffee while staying legal, not to chase 340 g exactly.
Quiz: Test Yourself
Eight questions on this capstone, from cleaning to the confidence interval. Answer them, hit Check Answers, and keep refining until you score 100%. Your progress is saved.